National Snow and Ice Data Center |
|
Atlas of the Cryosphere: Northern Hemisphere
| Service health Now: |
|---|
- Interface
- Web Service, OGC Web Map Service 1.1.1
- Keywords
- Arctic, Cryosphere, Earth Science, Frozen Ground, Glaciers, Ice Extent, Ice Sheets, Northern Hemisphere, Oceans, Permafrost, Polar, Sea Ice, Sea Ice Concentration, Snow/Ice, Snow Cover, Snow Melt, Snow Water Equivalent
- Fees
- none
- Access constraints
- none
- Data provider
-
National Snow and Ice Data Center (unverified)
Contact information:
NSIDC User Services
National Snow and Ice Data Center
mailing:
CIRES, 449 UCB, University of Colorado, 80309-0449 Boulder, USAEmail:
Phone: +1 303.492.6199
Ads by Google
The National Snow and Ice Data Center (NSIDC) Atlas of the Cryosphere is a map server that provides data and information pertinent to the frozen regions of Earth, including monthly climatologies of sea ice extent and concentration, snow cover extent, and snow water equivalent, in addition to glacier outlines, permafrost extent and classification, ice sheet elevation and accumulation, and more. In order to support polar projections, the Atlas is divided into two separate map servers: one for the Northern Hemisphere and one for the Southern Hemisphere. In addition to providing map images and source data through Open Geospatial Consortium, Inc. (OGC) protocols (WMS, WFS, and WCS), a dynamic web interface for exploring these data is also available at http://nsidc.org/data/atlas. If you have questions, comments or suggestions, please contact NSIDC User Services at +1.303.492.6199 or nsidc@nsidc.org. The development of this map server application was supported by NASA's Earth Observing System (EOS) Program under contract NAS5-03099 and was developed using MapServer, an Open Source development environment for building spatially-enabled internet applications. To cite the Atlas of the Cryosphere: Maurer, J. 2007. Atlas of the Cryosphere. Boulder, Colorado USA: National Snow and Ice Data Center. Digital media. Available at http://nsidc.org/data/atlas/.
Available map layers (98)
Atlas of the Cryosphere: Northern Hemisphere (cryosphere_atlas_north)
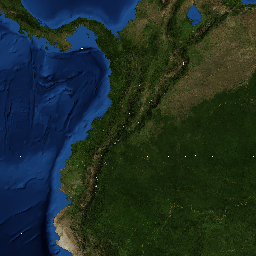
satellite imagery, January (2004) (blue_marble_01)
Stockli, R, Vermote, E., Saleous, N., Simmon R., and D. Herring. 2005. The Blue Marble Next Generation - A true color earth dataset including seasonal dynamics from MODIS. Greenbelt, Maryland USA: NASA Earth Observatory. Digital media. Available at ftp://sidads.colorado.edu/pub/DATASETS/BM/ and http://visibleearth.nasa.gov/view_set.php?categoryID=2355. Accessed 12 September 2007. Background: Cloud-free satellite image mosaic at 500-meter resolution compiled from NASA's Moderate-Resolution Imaging Spectroradiometer (MODIS) spaceborne remote sensing instrument for the month of January in 2004. Included in this data set is topographic and bathymetric relief shading from the Shuttle Radar Topography Mission (SRTM), GTOPO30, Radarsat Antarctic Mapping Project (RAMP) Digital Elevation Model (DEM) Version 2, and the General Bathymetric Chart of the Oceans (GEBCO).
satellite imagery, January (2004) (blue_marble_01_circle)
Stockli, R, Vermote, E., Saleous, N., Simmon R., and D. Herring. 2005. The Blue Marble Next Generation - A true color earth dataset including seasonal dynamics from MODIS. Greenbelt, Maryland USA: NASA Earth Observatory. Digital media. Available at ftp://sidads.colorado.edu/pub/DATASETS/BM/ and http://visibleearth.nasa.gov/view_set.php?categoryID=2355. Accessed 12 September 2007. Background: Cloud-free satellite image mosaic at 500-meter resolution compiled from NASA's Moderate-Resolution Imaging Spectroradiometer (MODIS) spaceborne remote sensing instrument for the month of January in 2004. Included in this data set is topographic and bathymetric relief shading from the Shuttle Radar Topography Mission (SRTM), GTOPO30, Radarsat Antarctic Mapping Project (RAMP) Digital Elevation Model (DEM) Version 2, and the General Bathymetric Chart of the Oceans (GEBCO). This layer only shows the imagery from the Northern Hemisphere, which has the appearance of a circle in a polar projection.
satellite imagery, July (2004) (blue_marble_07)
Stockli, R, Vermote, E., Saleous, N., Simmon R., and D. Herring. 2005. The Blue Marble Next Generation - A true color earth dataset including seasonal dynamics from MODIS. Greenbelt, Maryland USA: NASA Earth Observatory. Digital media. Available at ftp://sidads.colorado.edu/pub/DATASETS/BM/ and http://visibleearth.nasa.gov/view_set.php?categoryID=2355. Accessed 12 September 2007. Background: Cloud-free satellite image mosaic at 500-meter resolution compiled from NASA's Moderate-Resolution Imaging Spectroradiometer (MODIS) spaceborne remote sensing instrument for the month of July in 2004. Included in this data set is topographic and bathymetric relief shading from the Shuttle Radar Topography Mission (SRTM), GTOPO30, Radarsat Antarctic Mapping Project (RAMP) Digital Elevation Model (DEM) Version 2, and the General Bathymetric Chart of the Oceans (GEBCO).
satellite imagery, July (2004) (blue_marble_07_circle)
Stockli, R, Vermote, E., Saleous, N., Simmon R., and D. Herring. 2005. The Blue Marble Next Generation - A true color earth dataset including seasonal dynamics from MODIS. Greenbelt, Maryland USA: NASA Earth Observatory. Digital media. Available at ftp://sidads.colorado.edu/pub/DATASETS/BM/ and http://visibleearth.nasa.gov/view_set.php?categoryID=2355. Accessed 12 September 2007. Background: Cloud-free satellite image mosaic at 500-meter resolution compiled from NASA's Moderate-Resolution Imaging Spectroradiometer (MODIS) spaceborne remote sensing instrument for the month of July in 2004. Included in this data set is topographic and bathymetric relief shading from the Shuttle Radar Topography Mission (SRTM), GTOPO30, Radarsat Antarctic Mapping Project (RAMP) Digital Elevation Model (DEM) Version 2, and the General Bathymetric Chart of the Oceans (GEBCO). This layer only shows the imagery from the Northern Hemisphere, which has the appearance of a circle in a polar projection.
sea ice extent, January (1979-2007) (sea_ice_extent_01)
Stroeve, J. and W. Meier. 1999, updated 2008. Sea Ice Trends and Climatologies from SMMR and SSM/I. Boulder, Colorado USA: National Snow and Ice Data Center. Digital media. Available at http://nsidc.org/data/smmr_ssmi_ancillary/monthly_means.html. Accessed 27 June 2008. Compiled from: Cavalieri, D., C. Parkinson, P. Gloersen, and H. J. Zwally. 1996. Sea ice concentrations from Nimbus-7 SMMR and DMSP SSM/I passive microwave data. Boulder, Colorado USA: National Snow and Ice Data Center. Digital media. Available at http://nsidc.org/data/nsidc-0051.html. Background: Sea ice extent includes all areas where sea ice concentration is greater than or equal to 15%. Monthly climatologies of sea ice concentration represent mean ice concentration percentages for each month over the entire time period 1979-2007, which is generated from passive microwave brightness temperature data derived from Nimbus-7 Scanning Multichannel Microwave Radiometer (SMMR) and Defense Meteorological Satellite Program (DMSP) -F8, -F11 and -F13 Special Sensor Microwave/Imager (SSM/I) radiances at a grid cell size of 25 x 25 km using the NASA Team algorithm developed by the Oceans and Ice Branch, Laboratory for Hydrospheric Processes at NASA Goddard Space Flight Center (GSFC).
sea ice extent, February (1979-2007) (sea_ice_extent_02)
Stroeve, J. and W. Meier. 1999, updated 2008. Sea Ice Trends and Climatologies from SMMR and SSM/I. Boulder, Colorado USA: National Snow and Ice Data Center. Digital media. Available at http://nsidc.org/data/smmr_ssmi_ancillary/monthly_means.html. Accessed 27 June 2008. Compiled from: Cavalieri, D., C. Parkinson, P. Gloersen, and H. J. Zwally. 1996. Sea ice concentrations from Nimbus-7 SMMR and DMSP SSM/I passive microwave data. Boulder, Colorado USA: National Snow and Ice Data Center. Digital media. Available at http://nsidc.org/data/nsidc-0051.html. Background: Sea ice extent includes all areas where sea ice concentration is greater than or equal to 15%. Monthly climatologies of sea ice concentration represent mean ice concentration percentages for each month over the entire time period 1979-2007, which is generated from passive microwave brightness temperature data derived from Nimbus-7 Scanning Multichannel Microwave Radiometer (SMMR) and Defense Meteorological Satellite Program (DMSP) -F8, -F11 and -F13 Special Sensor Microwave/Imager (SSM/I) radiances at a grid cell size of 25 x 25 km using the NASA Team algorithm developed by the Oceans and Ice Branch, Laboratory for Hydrospheric Processes at NASA Goddard Space Flight Center (GSFC).
sea ice extent, March (1979-2007) (sea_ice_extent_03)
Stroeve, J. and W. Meier. 1999, updated 2008. Sea Ice Trends and Climatologies from SMMR and SSM/I. Boulder, Colorado USA: National Snow and Ice Data Center. Digital media. Available at http://nsidc.org/data/smmr_ssmi_ancillary/monthly_means.html. Accessed 27 June 2008. Compiled from: Cavalieri, D., C. Parkinson, P. Gloersen, and H. J. Zwally. 1996. Sea ice concentrations from Nimbus-7 SMMR and DMSP SSM/I passive microwave data. Boulder, Colorado USA: National Snow and Ice Data Center. Digital media. Available at http://nsidc.org/data/nsidc-0051.html. Background: Sea ice extent includes all areas where sea ice concentration is greater than or equal to 15%. Monthly climatologies of sea ice concentration represent mean ice concentration percentages for each month over the entire time period 1979-2007, which is generated from passive microwave brightness temperature data derived from Nimbus-7 Scanning Multichannel Microwave Radiometer (SMMR) and Defense Meteorological Satellite Program (DMSP) -F8, -F11 and -F13 Special Sensor Microwave/Imager (SSM/I) radiances at a grid cell size of 25 x 25 km using the NASA Team algorithm developed by the Oceans and Ice Branch, Laboratory for Hydrospheric Processes at NASA Goddard Space Flight Center (GSFC).
sea ice extent, April (1979-2007) (sea_ice_extent_04)
Stroeve, J. and W. Meier. 1999, updated 2008. Sea Ice Trends and Climatologies from SMMR and SSM/I. Boulder, Colorado USA: National Snow and Ice Data Center. Digital media. Available at http://nsidc.org/data/smmr_ssmi_ancillary/monthly_means.html. Accessed 27 June 2008. Compiled from: Cavalieri, D., C. Parkinson, P. Gloersen, and H. J. Zwally. 1996. Sea ice concentrations from Nimbus-7 SMMR and DMSP SSM/I passive microwave data. Boulder, Colorado USA: National Snow and Ice Data Center. Digital media. Available at http://nsidc.org/data/nsidc-0051.html. Background: Sea ice extent includes all areas where sea ice concentration is greater than or equal to 15%. Monthly climatologies of sea ice concentration represent mean ice concentration percentages for each month over the entire time period 1979-2007, which is generated from passive microwave brightness temperature data derived from Nimbus-7 Scanning Multichannel Microwave Radiometer (SMMR) and Defense Meteorological Satellite Program (DMSP) -F8, -F11 and -F13 Special Sensor Microwave/Imager (SSM/I) radiances at a grid cell size of 25 x 25 km using the NASA Team algorithm developed by the Oceans and Ice Branch, Laboratory for Hydrospheric Processes at NASA Goddard Space Flight Center (GSFC).
sea ice extent, May (1979-2007) (sea_ice_extent_05)
Stroeve, J. and W. Meier. 1999, updated 2008. Sea Ice Trends and Climatologies from SMMR and SSM/I. Boulder, Colorado USA: National Snow and Ice Data Center. Digital media. Available at http://nsidc.org/data/smmr_ssmi_ancillary/monthly_means.html. Accessed 27 June 2008. Compiled from: Cavalieri, D., C. Parkinson, P. Gloersen, and H. J. Zwally. 1996. Sea ice concentrations from Nimbus-7 SMMR and DMSP SSM/I passive microwave data. Boulder, Colorado USA: National Snow and Ice Data Center. Digital media. Available at http://nsidc.org/data/nsidc-0051.html. Background: Sea ice extent includes all areas where sea ice concentration is greater than or equal to 15%. Monthly climatologies of sea ice concentration represent mean ice concentration percentages for each month over the entire time period 1979-2007, which is generated from passive microwave brightness temperature data derived from Nimbus-7 Scanning Multichannel Microwave Radiometer (SMMR) and Defense Meteorological Satellite Program (DMSP) -F8, -F11 and -F13 Special Sensor Microwave/Imager (SSM/I) radiances at a grid cell size of 25 x 25 km using the NASA Team algorithm developed by the Oceans and Ice Branch, Laboratory for Hydrospheric Processes at NASA Goddard Space Flight Center (GSFC).
sea ice extent, June (1979-2007) (sea_ice_extent_06)
Stroeve, J. and W. Meier. 1999, updated 2008. Sea Ice Trends and Climatologies from SMMR and SSM/I. Boulder, Colorado USA: National Snow and Ice Data Center. Digital media. Available at http://nsidc.org/data/smmr_ssmi_ancillary/monthly_means.html. Accessed 27 June 2008. Compiled from: Cavalieri, D., C. Parkinson, P. Gloersen, and H. J. Zwally. 1996. Sea ice concentrations from Nimbus-7 SMMR and DMSP SSM/I passive microwave data. Boulder, Colorado USA: National Snow and Ice Data Center. Digital media. Available at http://nsidc.org/data/nsidc-0051.html. Background: Sea ice extent includes all areas where sea ice concentration is greater than or equal to 15%. Monthly climatologies of sea ice concentration represent mean ice concentration percentages for each month over the entire time period 1979-2007, which is generated from passive microwave brightness temperature data derived from Nimbus-7 Scanning Multichannel Microwave Radiometer (SMMR) and Defense Meteorological Satellite Program (DMSP) -F8, -F11 and -F13 Special Sensor Microwave/Imager (SSM/I) radiances at a grid cell size of 25 x 25 km using the NASA Team algorithm developed by the Oceans and Ice Branch, Laboratory for Hydrospheric Processes at NASA Goddard Space Flight Center (GSFC).
sea ice extent, July (1979-2007) (sea_ice_extent_07)
Stroeve, J. and W. Meier. 1999, updated 2008. Sea Ice Trends and Climatologies from SMMR and SSM/I. Boulder, Colorado USA: National Snow and Ice Data Center. Digital media. Available at http://nsidc.org/data/smmr_ssmi_ancillary/monthly_means.html. Accessed 27 June 2008. Compiled from: Cavalieri, D., C. Parkinson, P. Gloersen, and H. J. Zwally. 1996. Sea ice concentrations from Nimbus-7 SMMR and DMSP SSM/I passive microwave data. Boulder, Colorado USA: National Snow and Ice Data Center. Digital media. Available at http://nsidc.org/data/nsidc-0051.html. Background: Sea ice extent includes all areas where sea ice concentration is greater than or equal to 15%. Monthly climatologies of sea ice concentration represent mean ice concentration percentages for each month over the entire time period 1979-2007, which is generated from passive microwave brightness temperature data derived from Nimbus-7 Scanning Multichannel Microwave Radiometer (SMMR) and Defense Meteorological Satellite Program (DMSP) -F8, -F11 and -F13 Special Sensor Microwave/Imager (SSM/I) radiances at a grid cell size of 25 x 25 km using the NASA Team algorithm developed by the Oceans and Ice Branch, Laboratory for Hydrospheric Processes at NASA Goddard Space Flight Center (GSFC).
sea ice extent, August (1979-2007) (sea_ice_extent_08)
Stroeve, J. and W. Meier. 1999, updated 2008. Sea Ice Trends and Climatologies from SMMR and SSM/I. Boulder, Colorado USA: National Snow and Ice Data Center. Digital media. Available at http://nsidc.org/data/smmr_ssmi_ancillary/monthly_means.html. Accessed 27 June 2008. Compiled from: Cavalieri, D., C. Parkinson, P. Gloersen, and H. J. Zwally. 1996. Sea ice concentrations from Nimbus-7 SMMR and DMSP SSM/I passive microwave data. Boulder, Colorado USA: National Snow and Ice Data Center. Digital media. Available at http://nsidc.org/data/nsidc-0051.html. Background: Sea ice extent includes all areas where sea ice concentration is greater than or equal to 15%. Monthly climatologies of sea ice concentration represent mean ice concentration percentages for each month over the entire time period 1979-2007, which is generated from passive microwave brightness temperature data derived from Nimbus-7 Scanning Multichannel Microwave Radiometer (SMMR) and Defense Meteorological Satellite Program (DMSP) -F8, -F11 and -F13 Special Sensor Microwave/Imager (SSM/I) radiances at a grid cell size of 25 x 25 km using the NASA Team algorithm developed by the Oceans and Ice Branch, Laboratory for Hydrospheric Processes at NASA Goddard Space Flight Center (GSFC).
sea ice extent, September (1979-2007) (sea_ice_extent_09)
Stroeve, J. and W. Meier. 1999, updated 2008. Sea Ice Trends and Climatologies from SMMR and SSM/I. Boulder, Colorado USA: National Snow and Ice Data Center. Digital media. Available at http://nsidc.org/data/smmr_ssmi_ancillary/monthly_means.html. Accessed 27 June 2008. Compiled from: Cavalieri, D., C. Parkinson, P. Gloersen, and H. J. Zwally. 1996. Sea ice concentrations from Nimbus-7 SMMR and DMSP SSM/I passive microwave data. Boulder, Colorado USA: National Snow and Ice Data Center. Digital media. Available at http://nsidc.org/data/nsidc-0051.html. Background: Sea ice extent includes all areas where sea ice concentration is greater than or equal to 15%. Monthly climatologies of sea ice concentration represent mean ice concentration percentages for each month over the entire time period 1979-2007, which is generated from passive microwave brightness temperature data derived from Nimbus-7 Scanning Multichannel Microwave Radiometer (SMMR) and Defense Meteorological Satellite Program (DMSP) -F8, -F11 and -F13 Special Sensor Microwave/Imager (SSM/I) radiances at a grid cell size of 25 x 25 km using the NASA Team algorithm developed by the Oceans and Ice Branch, Laboratory for Hydrospheric Processes at NASA Goddard Space Flight Center (GSFC).
sea ice extent, October (1979-2007) (sea_ice_extent_10)
Stroeve, J. and W. Meier. 1999, updated 2008. Sea Ice Trends and Climatologies from SMMR and SSM/I. Boulder, Colorado USA: National Snow and Ice Data Center. Digital media. Available at http://nsidc.org/data/smmr_ssmi_ancillary/monthly_means.html. Accessed 27 June 2008. Compiled from: Cavalieri, D., C. Parkinson, P. Gloersen, and H. J. Zwally. 1996. Sea ice concentrations from Nimbus-7 SMMR and DMSP SSM/I passive microwave data. Boulder, Colorado USA: National Snow and Ice Data Center. Digital media. Available at http://nsidc.org/data/nsidc-0051.html. Background: Sea ice extent includes all areas where sea ice concentration is greater than or equal to 15%. Monthly climatologies of sea ice concentration represent mean ice concentration percentages for each month over the entire time period 1979-2007, which is generated from passive microwave brightness temperature data derived from Nimbus-7 Scanning Multichannel Microwave Radiometer (SMMR) and Defense Meteorological Satellite Program (DMSP) -F8, -F11 and -F13 Special Sensor Microwave/Imager (SSM/I) radiances at a grid cell size of 25 x 25 km using the NASA Team algorithm developed by the Oceans and Ice Branch, Laboratory for Hydrospheric Processes at NASA Goddard Space Flight Center (GSFC).
sea ice extent, November (1979-2007) (sea_ice_extent_11)
Stroeve, J. and W. Meier. 1999, updated 2008. Sea Ice Trends and Climatologies from SMMR and SSM/I. Boulder, Colorado USA: National Snow and Ice Data Center. Digital media. Available at http://nsidc.org/data/smmr_ssmi_ancillary/monthly_means.html. Accessed 27 June 2008. Compiled from: Cavalieri, D., C. Parkinson, P. Gloersen, and H. J. Zwally. 1996. Sea ice concentrations from Nimbus-7 SMMR and DMSP SSM/I passive microwave data. Boulder, Colorado USA: National Snow and Ice Data Center. Digital media. Available at http://nsidc.org/data/nsidc-0051.html. Background: Sea ice extent includes all areas where sea ice concentration is greater than or equal to 15%. Monthly climatologies of sea ice concentration represent mean ice concentration percentages for each month over the entire time period 1979-2007, which is generated from passive microwave brightness temperature data derived from Nimbus-7 Scanning Multichannel Microwave Radiometer (SMMR) and Defense Meteorological Satellite Program (DMSP) -F8, -F11 and -F13 Special Sensor Microwave/Imager (SSM/I) radiances at a grid cell size of 25 x 25 km using the NASA Team algorithm developed by the Oceans and Ice Branch, Laboratory for Hydrospheric Processes at NASA Goddard Space Flight Center (GSFC).
sea ice extent, December (1979-2007) (sea_ice_extent_12)
Stroeve, J. and W. Meier. 1999, updated 2008. Sea Ice Trends and Climatologies from SMMR and SSM/I. Boulder, Colorado USA: National Snow and Ice Data Center. Digital media. Available at http://nsidc.org/data/smmr_ssmi_ancillary/monthly_means.html. Accessed 27 June 2008. Compiled from: Cavalieri, D., C. Parkinson, P. Gloersen, and H. J. Zwally. 1996. Sea ice concentrations from Nimbus-7 SMMR and DMSP SSM/I passive microwave data. Boulder, Colorado USA: National Snow and Ice Data Center. Digital media. Available at http://nsidc.org/data/nsidc-0051.html. Background: Sea ice extent includes all areas where sea ice concentration is greater than or equal to 15%. Monthly climatologies of sea ice concentration represent mean ice concentration percentages for each month over the entire time period 1979-2007, which is generated from passive microwave brightness temperature data derived from Nimbus-7 Scanning Multichannel Microwave Radiometer (SMMR) and Defense Meteorological Satellite Program (DMSP) -F8, -F11 and -F13 Special Sensor Microwave/Imager (SSM/I) radiances at a grid cell size of 25 x 25 km using the NASA Team algorithm developed by the Oceans and Ice Branch, Laboratory for Hydrospheric Processes at NASA Goddard Space Flight Center (GSFC).
sea ice concentration, January (1979-2007) (sea_ice_concentration_01)
Stroeve, J. and W. Meier. 1999, updated 2008. Sea Ice Trends and Climatologies from SMMR and SSM/I. Boulder, Colorado USA: National Snow and Ice Data Center. Digital media. Available at http://nsidc.org/data/smmr_ssmi_ancillary/monthly_means.html. Accessed 27 June 2008. Compiled from: Cavalieri, D., C. Parkinson, P. Gloersen, and H. J. Zwally. 1996. Sea ice concentrations from Nimbus-7 SMMR and DMSP SSM/I passive microwave data. Boulder, Colorado USA: National Snow and Ice Data Center. Digital media. Available at http://nsidc.org/data/nsidc-0051.html. Background: Monthly climatologies of sea ice concentration represent mean ice concentration percentages for each month over the entire time period 1979-2007, which is generated from passive microwave brightness temperature data derived from Nimbus-7 Scanning Multichannel Microwave Radiometer (SMMR) and Defense Meteorological Satellite Program (DMSP) -F8, -F11 and -F13 Special Sensor Microwave/Imager (SSM/I) radiances at a grid cell size of 25 x 25 km using the NASA Team algorithm developed by the Oceans and Ice Branch, Laboratory for Hydrospheric Processes at NASA Goddard Space Flight Center (GSFC). A threshold of 15 percent concentration has been applied to the monthly climatologies.
sea ice concentration, February (1979-2007) (sea_ice_concentration_02)
Stroeve, J. and W. Meier. 1999, updated 2008. Sea Ice Trends and Climatologies from SMMR and SSM/I. Boulder, Colorado USA: National Snow and Ice Data Center. Digital media. Available at http://nsidc.org/data/smmr_ssmi_ancillary/monthly_means.html. Accessed 27 June 2008. Compiled from: Cavalieri, D., C. Parkinson, P. Gloersen, and H. J. Zwally. 1996. Sea ice concentrations from Nimbus-7 SMMR and DMSP SSM/I passive microwave data. Boulder, Colorado USA: National Snow and Ice Data Center. Digital media. Available at http://nsidc.org/data/nsidc-0051.html. Background: Monthly climatologies of sea ice concentration represent mean ice concentration percentages for each month over the entire time period 1979-2007, which is generated from passive microwave brightness temperature data derived from Nimbus-7 Scanning Multichannel Microwave Radiometer (SMMR) and Defense Meteorological Satellite Program (DMSP) -F8, -F11 and -F13 Special Sensor Microwave/Imager (SSM/I) radiances at a grid cell size of 25 x 25 km using the NASA Team algorithm developed by the Oceans and Ice Branch, Laboratory for Hydrospheric Processes at NASA Goddard Space Flight Center (GSFC). A threshold of 15 percent concentration has been applied to the monthly climatologies.
sea ice concentration, March (1979-2007) (sea_ice_concentration_03)
Stroeve, J. and W. Meier. 1999, updated 2008. Sea Ice Trends and Climatologies from SMMR and SSM/I. Boulder, Colorado USA: National Snow and Ice Data Center. Digital media. Available at http://nsidc.org/data/smmr_ssmi_ancillary/monthly_means.html. Accessed 27 June 2008. Compiled from: Cavalieri, D., C. Parkinson, P. Gloersen, and H. J. Zwally. 1996. Sea ice concentrations from Nimbus-7 SMMR and DMSP SSM/I passive microwave data. Boulder, Colorado USA: National Snow and Ice Data Center. Digital media. Available at http://nsidc.org/data/nsidc-0051.html. Background: Monthly climatologies of sea ice concentration represent mean ice concentration percentages for each month over the entire time period 1979-2007, which is generated from passive microwave brightness temperature data derived from Nimbus-7 Scanning Multichannel Microwave Radiometer (SMMR) and Defense Meteorological Satellite Program (DMSP) -F8, -F11 and -F13 Special Sensor Microwave/Imager (SSM/I) radiances at a grid cell size of 25 x 25 km using the NASA Team algorithm developed by the Oceans and Ice Branch, Laboratory for Hydrospheric Processes at NASA Goddard Space Flight Center (GSFC). A threshold of 15 percent concentration has been applied to the monthly climatologies.
sea ice concentration, April (1979-2007) (sea_ice_concentration_04)
Stroeve, J. and W. Meier. 1999, updated 2008. Sea Ice Trends and Climatologies from SMMR and SSM/I. Boulder, Colorado USA: National Snow and Ice Data Center. Digital media. Available at http://nsidc.org/data/smmr_ssmi_ancillary/monthly_means.html. Accessed 27 June 2008. Compiled from: Cavalieri, D., C. Parkinson, P. Gloersen, and H. J. Zwally. 1996. Sea ice concentrations from Nimbus-7 SMMR and DMSP SSM/I passive microwave data. Boulder, Colorado USA: National Snow and Ice Data Center. Digital media. Available at http://nsidc.org/data/nsidc-0051.html. Background: Monthly climatologies of sea ice concentration represent mean ice concentration percentages for each month over the entire time period 1979-2007, which is generated from passive microwave brightness temperature data derived from Nimbus-7 Scanning Multichannel Microwave Radiometer (SMMR) and Defense Meteorological Satellite Program (DMSP) -F8, -F11 and -F13 Special Sensor Microwave/Imager (SSM/I) radiances at a grid cell size of 25 x 25 km using the NASA Team algorithm developed by the Oceans and Ice Branch, Laboratory for Hydrospheric Processes at NASA Goddard Space Flight Center (GSFC). A threshold of 15 percent concentration has been applied to the monthly climatologies.
sea ice concentration, May (1979-2007) (sea_ice_concentration_05)
Stroeve, J. and W. Meier. 1999, updated 2008. Sea Ice Trends and Climatologies from SMMR and SSM/I. Boulder, Colorado USA: National Snow and Ice Data Center. Digital media. Available at http://nsidc.org/data/smmr_ssmi_ancillary/monthly_means.html. Accessed 27 June 2008. Compiled from: Cavalieri, D., C. Parkinson, P. Gloersen, and H. J. Zwally. 1996. Sea ice concentrations from Nimbus-7 SMMR and DMSP SSM/I passive microwave data. Boulder, Colorado USA: National Snow and Ice Data Center. Digital media. Available at http://nsidc.org/data/nsidc-0051.html. Background: Monthly climatologies of sea ice concentration represent mean ice concentration percentages for each month over the entire time period 1979-2007, which is generated from passive microwave brightness temperature data derived from Nimbus-7 Scanning Multichannel Microwave Radiometer (SMMR) and Defense Meteorological Satellite Program (DMSP) -F8, -F11 and -F13 Special Sensor Microwave/Imager (SSM/I) radiances at a grid cell size of 25 x 25 km using the NASA Team algorithm developed by the Oceans and Ice Branch, Laboratory for Hydrospheric Processes at NASA Goddard Space Flight Center (GSFC). A threshold of 15 percent concentration has been applied to the monthly climatologies.
sea ice concentration, June (1979-2007) (sea_ice_concentration_06)
Stroeve, J. and W. Meier. 1999, updated 2008. Sea Ice Trends and Climatologies from SMMR and SSM/I. Boulder, Colorado USA: National Snow and Ice Data Center. Digital media. Available at http://nsidc.org/data/smmr_ssmi_ancillary/monthly_means.html. Accessed 27 June 2008. Compiled from: Cavalieri, D., C. Parkinson, P. Gloersen, and H. J. Zwally. 1996. Sea ice concentrations from Nimbus-7 SMMR and DMSP SSM/I passive microwave data. Boulder, Colorado USA: National Snow and Ice Data Center. Digital media. Available at http://nsidc.org/data/nsidc-0051.html. Background: Monthly climatologies of sea ice concentration represent mean ice concentration percentages for each month over the entire time period 1979-2007, which is generated from passive microwave brightness temperature data derived from Nimbus-7 Scanning Multichannel Microwave Radiometer (SMMR) and Defense Meteorological Satellite Program (DMSP) -F8, -F11 and -F13 Special Sensor Microwave/Imager (SSM/I) radiances at a grid cell size of 25 x 25 km using the NASA Team algorithm developed by the Oceans and Ice Branch, Laboratory for Hydrospheric Processes at NASA Goddard Space Flight Center (GSFC). A threshold of 15 percent concentration has been applied to the monthly climatologies.
sea ice concentration, July (1979-2007) (sea_ice_concentration_07)
Stroeve, J. and W. Meier. 1999, updated 2008. Sea Ice Trends and Climatologies from SMMR and SSM/I. Boulder, Colorado USA: National Snow and Ice Data Center. Digital media. Available at http://nsidc.org/data/smmr_ssmi_ancillary/monthly_means.html. Accessed 27 June 2008. Compiled from: Cavalieri, D., C. Parkinson, P. Gloersen, and H. J. Zwally. 1996. Sea ice concentrations from Nimbus-7 SMMR and DMSP SSM/I passive microwave data. Boulder, Colorado USA: National Snow and Ice Data Center. Digital media. Available at http://nsidc.org/data/nsidc-0051.html. Background: Monthly climatologies of sea ice concentration represent mean ice concentration percentages for each month over the entire time period 1979-2007, which is generated from passive microwave brightness temperature data derived from Nimbus-7 Scanning Multichannel Microwave Radiometer (SMMR) and Defense Meteorological Satellite Program (DMSP) -F8, -F11 and -F13 Special Sensor Microwave/Imager (SSM/I) radiances at a grid cell size of 25 x 25 km using the NASA Team algorithm developed by the Oceans and Ice Branch, Laboratory for Hydrospheric Processes at NASA Goddard Space Flight Center (GSFC). A threshold of 15 percent concentration has been applied to the monthly climatologies.
sea ice concentration, August (1979-2007) (sea_ice_concentration_08)
Stroeve, J. and W. Meier. 1999, updated 2008. Sea Ice Trends and Climatologies from SMMR and SSM/I. Boulder, Colorado USA: National Snow and Ice Data Center. Digital media. Available at http://nsidc.org/data/smmr_ssmi_ancillary/monthly_means.html. Accessed 27 June 2008. Compiled from: Cavalieri, D., C. Parkinson, P. Gloersen, and H. J. Zwally. 1996. Sea ice concentrations from Nimbus-7 SMMR and DMSP SSM/I passive microwave data. Boulder, Colorado USA: National Snow and Ice Data Center. Digital media. Available at http://nsidc.org/data/nsidc-0051.html. Background: Monthly climatologies of sea ice concentration represent mean ice concentration percentages for each month over the entire time period 1979-2007, which is generated from passive microwave brightness temperature data derived from Nimbus-7 Scanning Multichannel Microwave Radiometer (SMMR) and Defense Meteorological Satellite Program (DMSP) -F8, -F11 and -F13 Special Sensor Microwave/Imager (SSM/I) radiances at a grid cell size of 25 x 25 km using the NASA Team algorithm developed by the Oceans and Ice Branch, Laboratory for Hydrospheric Processes at NASA Goddard Space Flight Center (GSFC). A threshold of 15 percent concentration has been applied to the monthly climatologies.
sea ice concentration, September (1979-2007) (sea_ice_concentration_09)
Stroeve, J. and W. Meier. 1999, updated 2008. Sea Ice Trends and Climatologies from SMMR and SSM/I. Boulder, Colorado USA: National Snow and Ice Data Center. Digital media. Available at http://nsidc.org/data/smmr_ssmi_ancillary/monthly_means.html. Accessed 27 June 2008. Compiled from: Cavalieri, D., C. Parkinson, P. Gloersen, and H. J. Zwally. 1996. Sea ice concentrations from Nimbus-7 SMMR and DMSP SSM/I passive microwave data. Boulder, Colorado USA: National Snow and Ice Data Center. Digital media. Available at http://nsidc.org/data/nsidc-0051.html. Background: Monthly climatologies of sea ice concentration represent mean ice concentration percentages for each month over the entire time period 1979-2007, which is generated from passive microwave brightness temperature data derived from Nimbus-7 Scanning Multichannel Microwave Radiometer (SMMR) and Defense Meteorological Satellite Program (DMSP) -F8, -F11 and -F13 Special Sensor Microwave/Imager (SSM/I) radiances at a grid cell size of 25 x 25 km using the NASA Team algorithm developed by the Oceans and Ice Branch, Laboratory for Hydrospheric Processes at NASA Goddard Space Flight Center (GSFC). A threshold of 15 percent concentration has been applied to the monthly climatologies.
sea ice concentration, October (1979-2007) (sea_ice_concentration_10)
Stroeve, J. and W. Meier. 1999, updated 2008. Sea Ice Trends and Climatologies from SMMR and SSM/I. Boulder, Colorado USA: National Snow and Ice Data Center. Digital media. Available at http://nsidc.org/data/smmr_ssmi_ancillary/monthly_means.html. Accessed 27 June 2008. Compiled from: Cavalieri, D., C. Parkinson, P. Gloersen, and H. J. Zwally. 1996. Sea ice concentrations from Nimbus-7 SMMR and DMSP SSM/I passive microwave data. Boulder, Colorado USA: National Snow and Ice Data Center. Digital media. Available at http://nsidc.org/data/nsidc-0051.html. Background: Monthly climatologies of sea ice concentration represent mean ice concentration percentages for each month over the entire time period 1979-2007, which is generated from passive microwave brightness temperature data derived from Nimbus-7 Scanning Multichannel Microwave Radiometer (SMMR) and Defense Meteorological Satellite Program (DMSP) -F8, -F11 and -F13 Special Sensor Microwave/Imager (SSM/I) radiances at a grid cell size of 25 x 25 km using the NASA Team algorithm developed by the Oceans and Ice Branch, Laboratory for Hydrospheric Processes at NASA Goddard Space Flight Center (GSFC). A threshold of 15 percent concentration has been applied to the monthly climatologies.
sea ice concentration, November (1979-2007) (sea_ice_concentration_11)
Stroeve, J. and W. Meier. 1999, updated 2008. Sea Ice Trends and Climatologies from SMMR and SSM/I. Boulder, Colorado USA: National Snow and Ice Data Center. Digital media. Available at http://nsidc.org/data/smmr_ssmi_ancillary/monthly_means.html. Accessed 27 June 2008. Compiled from: Cavalieri, D., C. Parkinson, P. Gloersen, and H. J. Zwally. 1996. Sea ice concentrations from Nimbus-7 SMMR and DMSP SSM/I passive microwave data. Boulder, Colorado USA: National Snow and Ice Data Center. Digital media. Available at http://nsidc.org/data/nsidc-0051.html. Background: Monthly climatologies of sea ice concentration represent mean ice concentration percentages for each month over the entire time period 1979-2007, which is generated from passive microwave brightness temperature data derived from Nimbus-7 Scanning Multichannel Microwave Radiometer (SMMR) and Defense Meteorological Satellite Program (DMSP) -F8, -F11 and -F13 Special Sensor Microwave/Imager (SSM/I) radiances at a grid cell size of 25 x 25 km using the NASA Team algorithm developed by the Oceans and Ice Branch, Laboratory for Hydrospheric Processes at NASA Goddard Space Flight Center (GSFC). A threshold of 15 percent concentration has been applied to the monthly climatologies.
sea ice concentration, December (1979-2007) (sea_ice_concentration_12)
Stroeve, J. and W. Meier. 1999, updated 2008. Sea Ice Trends and Climatologies from SMMR and SSM/I. Boulder, Colorado USA: National Snow and Ice Data Center. Digital media. Available at http://nsidc.org/data/smmr_ssmi_ancillary/monthly_means.html. Accessed 27 June 2008. Compiled from: Cavalieri, D., C. Parkinson, P. Gloersen, and H. J. Zwally. 1996. Sea ice concentrations from Nimbus-7 SMMR and DMSP SSM/I passive microwave data. Boulder, Colorado USA: National Snow and Ice Data Center. Digital media. Available at http://nsidc.org/data/nsidc-0051.html. Background: Monthly climatologies of sea ice concentration represent mean ice concentration percentages for each month over the entire time period 1979-2007, which is generated from passive microwave brightness temperature data derived from Nimbus-7 Scanning Multichannel Microwave Radiometer (SMMR) and Defense Meteorological Satellite Program (DMSP) -F8, -F11 and -F13 Special Sensor Microwave/Imager (SSM/I) radiances at a grid cell size of 25 x 25 km using the NASA Team algorithm developed by the Oceans and Ice Branch, Laboratory for Hydrospheric Processes at NASA Goddard Space Flight Center (GSFC). A threshold of 15 percent concentration has been applied to the monthly climatologies.
land (land)
Center for International Earth Science Information Network (CIESIN), Columbia University; and Centro Internacional de Agricultura Tropical (CIAT). 2005. Gridded Population of the World Version 3 (GPWv3): Coastlines. Palisades, NY, USA: Socioeconomic Data and Applications Center (SEDAC), Columbia University. Available at http://sedac.ciesin.columbia.edu/gpw. 19 January 2007. Background: Coastlines derived from the Gridded Population of the World (GPW) land area grid at 2.5 arc-minute resolution. Permanent ice and all but large lakes have been merged with neighbouring polygons to make a layer more appropriate for cartographic visualization of the data. Does not include Antarctica.
seasonal snow classification (seasonal_snow_classification)
Liston, G.E., and M. Sturm. 1998. Global seasonal snow classification system. Boulder, CO, USA: National Snow and Ice Data Center. Digital media. Available at http://nsidc.org/data/arcss045.html. 31 August 2006. Background: Based on the physical properties of the snow (depth, density, thermal conductivity, number of layers, degree of wetting, etc.), the world's seasonal snow covers are divided into six classes, plus classes for water and ice fields. Each class is defined by its physical properties, then empirically related to climate using three variables (precipitation, wind, and air temperature). A vegetation proxy was used for wind data: tall vegetation equals low wind, short vegetation equals high wind.
snow extent, January (1967-2005) (snow_extent_01)
Armstrong, R. L., and M. J. Brodzik. 2005. Northern Hemisphere EASE-Grid weekly snow cover and sea ice extent version 3. Boulder, CO, USA: National Snow and Ice Data Center. Digital media. Available at http://nsidc.org/data/nsidc-0046.html. 02 August 2006. Background: Snow cover extent is based on the digital NOAA-NESDIS Weekly Northern Hemisphere Snow Charts, revised by D. Robinson (Rutgers University) (http://climate.rutgers.edu/snowcover/) and regridded to the EASE-Grid. The original NOAA-NESDIS weekly snow charts are derived from the manual interpretation of AVHRR, GOES, and other visible-band satellite data.
snow extent, February (1967-2005) (snow_extent_02)
Armstrong, R. L., and M. J. Brodzik. 2005. Northern Hemisphere EASE-Grid weekly snow cover and sea ice extent version 3. Boulder, CO, USA: National Snow and Ice Data Center. Digital media. Available at http://nsidc.org/data/nsidc-0046.html. 02 August 2006. Background: Snow cover extent is based on the digital NOAA-NESDIS Weekly Northern Hemisphere Snow Charts, revised by D. Robinson (Rutgers University) (http://climate.rutgers.edu/snowcover/) and regridded to the EASE-Grid. The original NOAA-NESDIS weekly snow charts are derived from the manual interpretation of AVHRR, GOES, and other visible-band satellite data.
snow extent, March (1967-2005) (snow_extent_03)
Armstrong, R. L., and M. J. Brodzik. 2005. Northern Hemisphere EASE-Grid weekly snow cover and sea ice extent version 3. Boulder, CO, USA: National Snow and Ice Data Center. Digital media. Available at http://nsidc.org/data/nsidc-0046.html. 02 August 2006. Background: Snow cover extent is based on the digital NOAA-NESDIS Weekly Northern Hemisphere Snow Charts, revised by D. Robinson (Rutgers University) (http://climate.rutgers.edu/snowcover/) and regridded to the EASE-Grid. The original NOAA-NESDIS weekly snow charts are derived from the manual interpretation of AVHRR, GOES, and other visible-band satellite data.
snow extent, April (1967-2005) (snow_extent_04)
Armstrong, R. L., and M. J. Brodzik. 2005. Northern Hemisphere EASE-Grid weekly snow cover and sea ice extent version 3. Boulder, CO, USA: National Snow and Ice Data Center. Digital media. Available at http://nsidc.org/data/nsidc-0046.html. 02 August 2006. Background: Snow cover extent is based on the digital NOAA-NESDIS Weekly Northern Hemisphere Snow Charts, revised by D. Robinson (Rutgers University) (http://climate.rutgers.edu/snowcover/) and regridded to the EASE-Grid. The original NOAA-NESDIS weekly snow charts are derived from the manual interpretation of AVHRR, GOES, and other visible-band satellite data.
snow extent, May (1967-2005) (snow_extent_05)
Armstrong, R. L., and M. J. Brodzik. 2005. Northern Hemisphere EASE-Grid weekly snow cover and sea ice extent version 3. Boulder, CO, USA: National Snow and Ice Data Center. Digital media. Available at http://nsidc.org/data/nsidc-0046.html. 02 August 2006. Background: Snow cover extent is based on the digital NOAA-NESDIS Weekly Northern Hemisphere Snow Charts, revised by D. Robinson (Rutgers University) (http://climate.rutgers.edu/snowcover/) and regridded to the EASE-Grid. The original NOAA-NESDIS weekly snow charts are derived from the manual interpretation of AVHRR, GOES, and other visible-band satellite data.
snow extent, June (1967-2004) (snow_extent_06)
Armstrong, R. L., and M. J. Brodzik. 2005. Northern Hemisphere EASE-Grid weekly snow cover and sea ice extent version 3. Boulder, CO, USA: National Snow and Ice Data Center. Digital media. Available at http://nsidc.org/data/nsidc-0046.html. 02 August 2006. Background: Snow cover extent is based on the digital NOAA-NESDIS Weekly Northern Hemisphere Snow Charts, revised by D. Robinson (Rutgers University) (http://climate.rutgers.edu/snowcover/) and regridded to the EASE-Grid. The original NOAA-NESDIS weekly snow charts are derived from the manual interpretation of AVHRR, GOES, and other visible-band satellite data.
snow extent, July (1967-2004) (snow_extent_07)
Armstrong, R. L., and M. J. Brodzik. 2005. Northern Hemisphere EASE-Grid weekly snow cover and sea ice extent version 3. Boulder, CO, USA: National Snow and Ice Data Center. Digital media. Available at http://nsidc.org/data/nsidc-0046.html. 02 August 2006. Background: Snow cover extent is based on the digital NOAA-NESDIS Weekly Northern Hemisphere Snow Charts, revised by D. Robinson (Rutgers University) (http://climate.rutgers.edu/snowcover/) and regridded to the EASE-Grid. The original NOAA-NESDIS weekly snow charts are derived from the manual interpretation of AVHRR, GOES, and other visible-band satellite data.
snow extent, August (1967-2004) (snow_extent_08)
Armstrong, R. L., and M. J. Brodzik. 2005. Northern Hemisphere EASE-Grid weekly snow cover and sea ice extent version 3. Boulder, CO, USA: National Snow and Ice Data Center. Digital media. Available at http://nsidc.org/data/nsidc-0046.html. 02 August 2006. Background: Snow cover extent is based on the digital NOAA-NESDIS Weekly Northern Hemisphere Snow Charts, revised by D. Robinson (Rutgers University) (http://climate.rutgers.edu/snowcover/) and regridded to the EASE-Grid. The original NOAA-NESDIS weekly snow charts are derived from the manual interpretation of AVHRR, GOES, and other visible-band satellite data.
snow extent, September (1967-2004) (snow_extent_09)
Armstrong, R. L., and M. J. Brodzik. 2005. Northern Hemisphere EASE-Grid weekly snow cover and sea ice extent version 3. Boulder, CO, USA: National Snow and Ice Data Center. Digital media. Available at http://nsidc.org/data/nsidc-0046.html. 02 August 2006. Background: Snow cover extent is based on the digital NOAA-NESDIS Weekly Northern Hemisphere Snow Charts, revised by D. Robinson (Rutgers University) (http://climate.rutgers.edu/snowcover/) and regridded to the EASE-Grid. The original NOAA-NESDIS weekly snow charts are derived from the manual interpretation of AVHRR, GOES, and other visible-band satellite data.
snow extent, October (1967-2004) (snow_extent_10)
Armstrong, R. L., and M. J. Brodzik. 2005. Northern Hemisphere EASE-Grid weekly snow cover and sea ice extent version 3. Boulder, CO, USA: National Snow and Ice Data Center. Digital media. Available at http://nsidc.org/data/nsidc-0046.html. 02 August 2006. Background: Snow cover extent is based on the digital NOAA-NESDIS Weekly Northern Hemisphere Snow Charts, revised by D. Robinson (Rutgers University) (http://climate.rutgers.edu/snowcover/) and regridded to the EASE-Grid. The original NOAA-NESDIS weekly snow charts are derived from the manual interpretation of AVHRR, GOES, and other visible-band satellite data.
snow extent, November (1966-2004) (snow_extent_11)
Armstrong, R. L., and M. J. Brodzik. 2005. Northern Hemisphere EASE-Grid weekly snow cover and sea ice extent version 3. Boulder, CO, USA: National Snow and Ice Data Center. Digital media. Available at http://nsidc.org/data/nsidc-0046.html. 02 August 2006. Background: Snow cover extent is based on the digital NOAA-NESDIS Weekly Northern Hemisphere Snow Charts, revised by D. Robinson (Rutgers University) (http://climate.rutgers.edu/snowcover/) and regridded to the EASE-Grid. The original NOAA-NESDIS weekly snow charts are derived from the manual interpretation of AVHRR, GOES, and other visible-band satellite data.
snow extent, December (1966-2004) (snow_extent_12)
Armstrong, R. L., and M. J. Brodzik. 2005. Northern Hemisphere EASE-Grid weekly snow cover and sea ice extent version 3. Boulder, CO, USA: National Snow and Ice Data Center. Digital media. Available at http://nsidc.org/data/nsidc-0046.html. 02 August 2006. Background: Snow cover extent is based on the digital NOAA-NESDIS Weekly Northern Hemisphere Snow Charts, revised by D. Robinson (Rutgers University) (http://climate.rutgers.edu/snowcover/) and regridded to the EASE-Grid. The original NOAA-NESDIS weekly snow charts are derived from the manual interpretation of AVHRR, GOES, and other visible-band satellite data.
snow water equivalent, January (1988-2003) (snow_water_equivalent_01)
Armstrong, R.L., M.J. Brodzik, K. Knowles, and M. Savoie. 2005. Global monthly EASE-Grid snow water equivalent climatology. Boulder, CO, USA: National Snow and Ice Data Center. Digital media. Available at http://nsidc.org/data/nsidc-0271.html. 30 August 2006. Background: Global, monthly snow water equivalent (SWE) climatologies are generated from passive microwave brightness temperature data derived from Nimbus-7 Scanning Multichannel Microwave Radiometer (SMMR) and Defense Meteorological Satellite Program (DMSP) -F8, -F11 and -F13 Special Sensor Microwave/Imager (SSM/I) radiances and gridded to the Northern and Southern 25 km Equal-Area Scalable Earth Grids (EASE-Grids).
snow water equivalent, February (1988-2003) (snow_water_equivalent_02)
Armstrong, R.L., M.J. Brodzik, K. Knowles, and M. Savoie. 2005. Global monthly EASE-Grid snow water equivalent climatology. Boulder, CO, USA: National Snow and Ice Data Center. Digital media. Available at http://nsidc.org/data/nsidc-0271.html. 30 August 2006. Background: Global, monthly snow water equivalent (SWE) climatologies are generated from passive microwave brightness temperature data derived from Nimbus-7 Scanning Multichannel Microwave Radiometer (SMMR) and Defense Meteorological Satellite Program (DMSP) -F8, -F11 and -F13 Special Sensor Microwave/Imager (SSM/I) radiances and gridded to the Northern and Southern 25 km Equal-Area Scalable Earth Grids (EASE-Grids).
snow water equivalent, March (1988-2003) (snow_water_equivalent_03)
Armstrong, R.L., M.J. Brodzik, K. Knowles, and M. Savoie. 2005. Global monthly EASE-Grid snow water equivalent climatology. Boulder, CO, USA: National Snow and Ice Data Center. Digital media. Available at http://nsidc.org/data/nsidc-0271.html. 30 August 2006. Background: Global, monthly snow water equivalent (SWE) climatologies are generated from passive microwave brightness temperature data derived from Nimbus-7 Scanning Multichannel Microwave Radiometer (SMMR) and Defense Meteorological Satellite Program (DMSP) -F8, -F11 and -F13 Special Sensor Microwave/Imager (SSM/I) radiances and gridded to the Northern and Southern 25 km Equal-Area Scalable Earth Grids (EASE-Grids).
snow water equivalent, April (1988-2003) (snow_water_equivalent_04)
Armstrong, R.L., M.J. Brodzik, K. Knowles, and M. Savoie. 2005. Global monthly EASE-Grid snow water equivalent climatology. Boulder, CO, USA: National Snow and Ice Data Center. Digital media. Available at http://nsidc.org/data/nsidc-0271.html. 30 August 2006. Background: Global, monthly snow water equivalent (SWE) climatologies are generated from passive microwave brightness temperature data derived from Nimbus-7 Scanning Multichannel Microwave Radiometer (SMMR) and Defense Meteorological Satellite Program (DMSP) -F8, -F11 and -F13 Special Sensor Microwave/Imager (SSM/I) radiances and gridded to the Northern and Southern 25 km Equal-Area Scalable Earth Grids (EASE-Grids).
snow water equivalent, May (1988-2003) (snow_water_equivalent_05)
Armstrong, R.L., M.J. Brodzik, K. Knowles, and M. Savoie. 2005. Global monthly EASE-Grid snow water equivalent climatology. Boulder, CO, USA: National Snow and Ice Data Center. Digital media. Available at http://nsidc.org/data/nsidc-0271.html. 30 August 2006. Background: Global, monthly snow water equivalent (SWE) climatologies are generated from passive microwave brightness temperature data derived from Nimbus-7 Scanning Multichannel Microwave Radiometer (SMMR) and Defense Meteorological Satellite Program (DMSP) -F8, -F11 and -F13 Special Sensor Microwave/Imager (SSM/I) radiances and gridded to the Northern and Southern 25 km Equal-Area Scalable Earth Grids (EASE-Grids).
snow water equivalent, June (1988-2003) (snow_water_equivalent_06)
Armstrong, R.L., M.J. Brodzik, K. Knowles, and M. Savoie. 2005. Global monthly EASE-Grid snow water equivalent climatology. Boulder, CO, USA: National Snow and Ice Data Center. Digital media. Available at http://nsidc.org/data/nsidc-0271.html. 30 August 2006. Background: Global, monthly snow water equivalent (SWE) climatologies are generated from passive microwave brightness temperature data derived from Nimbus-7 Scanning Multichannel Microwave Radiometer (SMMR) and Defense Meteorological Satellite Program (DMSP) -F8, -F11 and -F13 Special Sensor Microwave/Imager (SSM/I) radiances and gridded to the Northern and Southern 25 km Equal-Area Scalable Earth Grids (EASE-Grids).
snow water equivalent, July (1988-2002) (snow_water_equivalent_07)
Armstrong, R.L., M.J. Brodzik, K. Knowles, and M. Savoie. 2005. Global monthly EASE-Grid snow water equivalent climatology. Boulder, CO, USA: National Snow and Ice Data Center. Digital media. Available at http://nsidc.org/data/nsidc-0271.html. 30 August 2006. Background: Global, monthly snow water equivalent (SWE) climatologies are generated from passive microwave brightness temperature data derived from Nimbus-7 Scanning Multichannel Microwave Radiometer (SMMR) and Defense Meteorological Satellite Program (DMSP) -F8, -F11 and -F13 Special Sensor Microwave/Imager (SSM/I) radiances and gridded to the Northern and Southern 25 km Equal-Area Scalable Earth Grids (EASE-Grids).
snow water equivalent, August (1987-2002) (snow_water_equivalent_08)
Armstrong, R.L., M.J. Brodzik, K. Knowles, and M. Savoie. 2005. Global monthly EASE-Grid snow water equivalent climatology. Boulder, CO, USA: National Snow and Ice Data Center. Digital media. Available at http://nsidc.org/data/nsidc-0271.html. 30 August 2006. Background: Global, monthly snow water equivalent (SWE) climatologies are generated from passive microwave brightness temperature data derived from Nimbus-7 Scanning Multichannel Microwave Radiometer (SMMR) and Defense Meteorological Satellite Program (DMSP) -F8, -F11 and -F13 Special Sensor Microwave/Imager (SSM/I) radiances and gridded to the Northern and Southern 25 km Equal-Area Scalable Earth Grids (EASE-Grids).
snow water equivalent, September (1987-2002) (snow_water_equivalent_09)
Armstrong, R.L., M.J. Brodzik, K. Knowles, and M. Savoie. 2005. Global monthly EASE-Grid snow water equivalent climatology. Boulder, CO, USA: National Snow and Ice Data Center. Digital media. Available at http://nsidc.org/data/nsidc-0271.html. 30 August 2006. Background: Global, monthly snow water equivalent (SWE) climatologies are generated from passive microwave brightness temperature data derived from Nimbus-7 Scanning Multichannel Microwave Radiometer (SMMR) and Defense Meteorological Satellite Program (DMSP) -F8, -F11 and -F13 Special Sensor Microwave/Imager (SSM/I) radiances and gridded to the Northern and Southern 25 km Equal-Area Scalable Earth Grids (EASE-Grids).
snow water equivalent, October (1987-2002) (snow_water_equivalent_10)
Armstrong, R.L., M.J. Brodzik, K. Knowles, and M. Savoie. 2005. Global monthly EASE-Grid snow water equivalent climatology. Boulder, CO, USA: National Snow and Ice Data Center. Digital media. Available at http://nsidc.org/data/nsidc-0271.html. 30 August 2006. Background: Global, monthly snow water equivalent (SWE) climatologies are generated from passive microwave brightness temperature data derived from Nimbus-7 Scanning Multichannel Microwave Radiometer (SMMR) and Defense Meteorological Satellite Program (DMSP) -F8, -F11 and -F13 Special Sensor Microwave/Imager (SSM/I) radiances and gridded to the Northern and Southern 25 km Equal-Area Scalable Earth Grids (EASE-Grids).
snow water equivalent, November (1987-2002) (snow_water_equivalent_11)
Armstrong, R.L., M.J. Brodzik, K. Knowles, and M. Savoie. 2005. Global monthly EASE-Grid snow water equivalent climatology. Boulder, CO, USA: National Snow and Ice Data Center. Digital media. Available at http://nsidc.org/data/nsidc-0271.html. 30 August 2006. Background: Global, monthly snow water equivalent (SWE) climatologies are generated from passive microwave brightness temperature data derived from Nimbus-7 Scanning Multichannel Microwave Radiometer (SMMR) and Defense Meteorological Satellite Program (DMSP) -F8, -F11 and -F13 Special Sensor Microwave/Imager (SSM/I) radiances and gridded to the Northern and Southern 25 km Equal-Area Scalable Earth Grids (EASE-Grids).
snow water equivalent, December (1987-2002) (snow_water_equivalent_12)
Armstrong, R.L., M.J. Brodzik, K. Knowles, and M. Savoie. 2005. Global monthly EASE-Grid snow water equivalent climatology. Boulder, CO, USA: National Snow and Ice Data Center. Digital media. Available at http://nsidc.org/data/nsidc-0271.html. 30 August 2006. Background: Global, monthly snow water equivalent (SWE) climatologies are generated from passive microwave brightness temperature data derived from Nimbus-7 Scanning Multichannel Microwave Radiometer (SMMR) and Defense Meteorological Satellite Program (DMSP) -F8, -F11 and -F13 Special Sensor Microwave/Imager (SSM/I) radiances and gridded to the Northern and Southern 25 km Equal-Area Scalable Earth Grids (EASE-Grids).
Greenland surface melt (1979-2004) (greenland_surface_melt)
Abdalati, W. 2007. Greenland ice sheet melt characteristics derived from passive microwave data. Boulder, Colorado USA: National Snow and Ice Data Center. Digital Media. Available at http://nsidc.org/data/nsidc-0218.html. 17 July 2007. Background: The ice sheet melt extent is a daily (or every-other-day, prior to August, 1987) estimate of the spatial extent of wet snow on the Greenland ice sheet derived from passive microwave satellite brightness temperature characteristics using the cross-polarized gradient ratio of Abdalati and Steffen (J. Climate, 1997). It is physically based on the changes in microwave emission characteristics observable in data from the Scanning Multi-channel Microwave Radiometer (SMMR) and the Special Sensor Microwave Imager (SSM/I). It is not a direct measure of the snow wetness, but rather is a binary indicator of the state of melt of each SMMR and SSM/I pixel on the ice sheet for each day of observation. It is, however a useful proxy for the amount of ablation that occurs on the Greenland ice sheet.
Greenland snow accumulation (1971-1990) (greenland_accumulation)
Bales, R.C., J.R. McConnell, E. Mosley-Thompson, and G. Lamorey. 2001. Accumulation map for the Greenland Ice Sheet: 1971-1990. Geophysical Research Letters. 28(15): 2967-2970. doi:10.1029/2000GL012052. Available at http://zero.eng.ucmerced.edu/rcbales/PARCA/. 24 October 2006. Background: An updated accumulation map for the Greenland Ice Sheet for the period 1971-1990, based on kriging of accurate in situ point estimates developed during the past decade at over 40 points (shallow ice cores) plus over 200 historical points (from snow pits, probes, shallow cores, and coastal precipitation data), shows an average water accumulation of 300 mm snow water equivalent (SWE) per year. Average uncertainty (standard deviation) in estimates of point accumulation for the interior part of the ice sheet, where the kriging drift surface is well constrained, is approximately 70 mm SWE per year, or 24% of mean accumulation. Because there are multiple cores in most regions, the regional uncertainty in accumulation should be considerably lower than the 70 mm SWE per year average uncertainty at a point. There are still many areas on the ice sheet, including northwest and southern Greenland, where annual accumulation remains poorly constrained.
Greenland bedrock elevation (greenland_bedrock_elevation)
Bamber, J.L., R.L. Layberry, S.P. Gogenini. 2001. A new ice thickness and bed data set for the Greenland ice sheet 1: Measurement, data reduction, and errors. Journal of Geophysical Research. 106(D24): 33773-33780. Data provided by the National Snow and Ice Data Center DAAC, University of Colorado, Boulder, CO, USA. Available at http://nsidc.org/data/nsidc-0092.html. 25 October 2006. Bamber, J.L., R.L. Layberry, S.P. Gogenini. 2001. A new ice thickness and bed data set for the Greenland ice sheet 2: Relationship between dynamics and basal topography. Journal of Geophysical Research. 106(D24): 33781-33788. Data provided by the National Snow and Ice Data Center DAAC, University of Colorado, Boulder, CO, USA. Available at http://nsidc.org/data/nsidc-0092.html. 25 October 2006. Background: Digital Elevation Model (DEM) data are a combination of European Remote-Sensing (ERS-1) and Geosat satellite radar altimetry data, Airborne Topographic Mapper (ATM) data, and photogrammetric digital height data. Ice thickness data are based on approximately 700,000 data points collected in the 1990s from a University of Kansas airborne ice penetrating radar (IPR). Nearly 30,000 data points were collected in the 1970s from a Technical University of Denmark (TUD) airborne echo sounder. Bamber subtracted the ice thickness grid from the DEM to produce a grid of bedrock elevation values.
Greenland ice sheet thickness (greenland_ice_thickness)
Bamber, J.L., R.L. Layberry, S.P. Gogenini. 2001. A new ice thickness and bed data set for the Greenland ice sheet 1: Measurement, data reduction, and errors. Journal of Geophysical Research. 106(D24): 33773-33780. Data provided by the National Snow and Ice Data Center DAAC, University of Colorado, Boulder, CO, USA. Available at http://nsidc.org/data/nsidc-0092.html. 25 October 2006. Bamber, J.L., R.L. Layberry, S.P. Gogenini. 2001. A new ice thickness and bed data set for the Greenland ice sheet 2: Relationship between dynamics and basal topography. Journal of Geophysical Research. 106(D24): 33781-33788. Data provided by the National Snow and Ice Data Center DAAC, University of Colorado, Boulder, CO, USA. Available at http://nsidc.org/data/nsidc-0092.html. 25 October 2006. Background: Ice thickness data are based on approximately 700,000 data points collected in the 1990s from a University of Kansas airborne ice penetrating radar (IPR). Nearly 30,000 data points were collected in the 1970s from a Technical University of Denmark (TUD) airborne echo sounder.
Greenland surface elevation (greenland_elevation)
Bamber, J.L., R.L. Layberry, S.P. Gogenini. 2001. A new ice thickness and bed data set for the Greenland ice sheet 1: Measurement, data reduction, and errors. Journal of Geophysical Research. 106(D24): 33773-33780. Data provided by the National Snow and Ice Data Center DAAC, University of Colorado, Boulder, CO, USA. Available at http://nsidc.org/data/nsidc-0092.html. 25 October 2006. Bamber, J.L., R.L. Layberry, S.P. Gogenini. 2001. A new ice thickness and bed data set for the Greenland ice sheet 2: Relationship between dynamics and basal topography. Journal of Geophysical Research. 106(D24): 33781-33788. Data provided by the National Snow and Ice Data Center DAAC, University of Colorado, Boulder, CO, USA. Available at http://nsidc.org/data/nsidc-0092.html. 25 October 2006. Background: Digital Elevation Model (DEM) data are a combination of European Remote-Sensing (ERS-1) and Geosat satellite radar altimetry data, Airborne Topographic Mapper (ATM) data, and photogrammetric digital height data.
Greenland surface elevation contours (greenland_elevation_contours)
Bamber, J.L., R.L. Layberry, S.P. Gogenini. 2001. A new ice thickness and bed data set for the Greenland ice sheet 1: Measurement, data reduction, and errors. Journal of Geophysical Research. 106(D24): 33773-33780. Data provided by the National Snow and Ice Data Center DAAC, University of Colorado, Boulder, CO, USA. Available at http://nsidc.org/data/nsidc-0092.html. 25 October 2006. Bamber, J.L., R.L. Layberry, S.P. Gogenini. 2001. A new ice thickness and bed data set for the Greenland ice sheet 2: Relationship between dynamics and basal topography. Journal of Geophysical Research. 106(D24): 33781-33788. Data provided by the National Snow and Ice Data Center DAAC, University of Colorado, Boulder, CO, USA. Available at http://nsidc.org/data/nsidc-0092.html. 25 October 2006. Background: Digital Elevation Model (DEM) data are a combination of European Remote-Sensing (ERS-1) and Geosat satellite radar altimetry data, Airborne Topographic Mapper (ATM) data, and photogrammetric digital height data.
permafrost extent (permafrost_extent)
Brown, J., O.J. Ferrians Jr., J.A. Heginbottom, and E.S. Melnikov. 1998. revised February 2001. Circum-Arctic map of permafrost and ground-ice conditions. Boulder, CO, USA: National Snow and Ice Data Center. Available at http://nsidc.org/data/ggd318.html. 07 September 2006. Background: Permafrost, or permanently frozen ground, is ground (soil, sediment, or rock) that remains at or below 0 deg C for at least two years (Permafrost Subcommittee, 1988). It occurs both on land and beneath offshore arctic continental shelves, and underlies about 22% of the Earth's land surface. The circumpolar permafrost and ground ice data contribute to a unified international data set that depicts the distribution and properties of permafrost and ground ice in the Northern Hemisphere (20 deg N to 90 deg N). The re-gridded data set shows discontinuous, sporadic, or isolated permafrost boundaries. Permafrost extent is estimated in percent area (90-100%, 50-90%, 10-50%, <10%, and no permafrost). The shapefiles were derived from the original 1:10,000,000 paper map (Brown et al. 1997). For more information on the creation of the original map, see Heginbottom et al. (1993).
permafrost ground-ice conditions (permafrost_classification)
Brown, J., O.J. Ferrians Jr., J.A. Heginbottom, and E.S. Melnikov. 1998. revised February 2001. Circum-Arctic map of permafrost and ground-ice conditions. Boulder, CO, USA: National Snow and Ice Data Center. Available at http://nsidc.org/data/ggd318.html. 07 September 2006. Background: Permafrost, or permanently frozen ground, is ground (soil, sediment, or rock) that remains at or below 0 deg C for at least two years (Permafrost Subcommittee, 1988). It occurs both on land and beneath offshore arctic continental shelves, and underlies about 22% of the Earth's land surface. The circumpolar permafrost and ground ice data contribute to a unified international data set that depicts the distribution and properties of permafrost and ground ice in the Northern Hemisphere (20 deg N to 90 deg N). The re-gridded data set shows discontinuous, sporadic, or isolated permafrost boundaries. Permafrost extent is estimated in percent area (90-100%, 50-90%, 10-50%, 20%, 10-20%, <10%, and 0%). The shapefiles were derived from the original 1:10,000,000 paper map (Brown et al. 1997). For more information on the creation of the original map, see Heginbottom et al. (1993).
treeline (treeline)
CAVM Team. 2003. Circumpolar Arctic Vegetation Map. Scale 1:7,500,000. Conservation of Arctic Flora and Fauna (CAFF) Map No. 1. U.S. Fish and Wildlife Service, Anchorage, Alaska, USA. Treeline available at http://www.geobotany.uaf.edu/cavm/data/treeline_la.zip. 24 August 2006. Background: The Circumpolar Arctic Vegetation Map (CAVM) shows the types of vegetation that occur across the Arctic, between the ice-covered Arctic Ocean to the north and the northern limit of forests to the south. The CAVM team grouped over 400 described plant communities into 15 different physiognomic units based on plant growth forms. An international team of arctic vegetation scientists representing the six countries of the Arctic--Canada, Greenland, Iceland, Norway, Russia, and the United States--prepared the map.
glaciers (glaciers)
National Imagery and Mapping Agency (NIMA). 1992. VMAP_1V10 - Vector Map Level 0 (Digital Chart of the World). Bethesda, MD, USA: National Imagery and Mapping Agency (NIMA). Available at http://www.maproom.psu.edu/dcw/ and http://webgis.wr.usgs.gov/globalgis/. 01 September 2000. Background: The primary source for this database is the U.S. Defense Mapping Agency's (DMA) Operational Navigation Chart (ONC) 1:1,000,000 scale paper map series produced by the United States, Australia, Canada, and the United Kingdom. These charts were designed to meet the needs of pilots and air crews in medium-and low-altitude en route navigation and to support military operational planning, intelligence briefings, and other needs. Level 0 (low resolution) coverage is global, and is entirely in the public domain. The National Imagery and Mapping Agency (NIMA) is a federal agency of the United States Government and is now known as the National Geospatial-Intelligence Agency (NGA).
glacier outlines (glacier_outlines)
Armstrong, R., B. Raup, S.J.S. Khalsa, R. Barry, J. Kargel, C. Helm, and H. Kiefer. 2005. GLIMS glacier database. Boulder, CO, USA: National Snow and Ice Data Center. Available at http://nsidc.org/data/nsidc-0272.html. 24 August 2006. Background: Global Land Ice Measurements from Space (GLIMS) is an international project with the goal of surveying a majority of the world's estimated 160,000 glaciers. GLIMS uses data collected primarily by the Advanced Spaceborne Thermal Emission and Reflection Radiometer (ASTER) instrument aboard the Terra satellite and the LANDSAT Enhanced Thematic Mapper Plus (ETM+), along with historical observations. The GLIMS project is currently creating a unique glacier inventory, storing information about the extent and rates of change of all the world's glacial resources. GLIMS consists of many institutions called Regional Centers, who produce glacier analyses for their particular region. The GLIMS Glacier Database provides students, educators, scientists, and the public with reliable glacier data from these analyses. New glacier data are continually being added to the database.
coastlines (coastlines)
Center for International Earth Science Information Network (CIESIN), Columbia University; and Centro Internacional de Agricultura Tropical (CIAT). 2005. Gridded Population of the World Version 3 (GPWv3): Coastlines. Palisades, NY, USA: Socioeconomic Data and Applications Center (SEDAC), Columbia University. Available at http://sedac.ciesin.columbia.edu/gpw. 19 January 2007. Background: Coastlines derived from the Gridded Population of the World (GPW) land area grid at 2.5 arc-minute resolution. Permanent ice and all but large lakes have been merged with neighbouring polygons to make a layer more appropriate for cartographic visualization of the data. Does not include Antarctica.
countries (country_borders)
Center for International Earth Science Information Network (CIESIN), Columbia University; and Centro Internacional de Agricultura Tropical (CIAT). 2005. Gridded Population of the World Version 3 (GPWv3): National Boundaries. Palisades, NY, USA: Socioeconomic Data and Applications Center (SEDAC), Columbia University. Available at http://sedac.ciesin.columbia.edu/gpw. 19 January 2007. Background: National boundaries derived from the Gridded Population of the World (GPW) country-level land area grids at 2.5 arc-minute resolution. Permanent ice and all but large lakes have been merged with neighbouring polygons to make a layer more appropriate for cartographic visualization of the data. Does not include Antarctica.
country labels (country_labels)
Center for International Earth Science Information Network (CIESIN), Columbia University; and Centro Internacional de Agricultura Tropical (CIAT). 2005. Gridded Population of the World Version 3 (GPWv3): National Boundaries. Palisades, NY, USA: Socioeconomic Data and Applications Center (SEDAC), Columbia University. Available at http://sedac.ciesin.columbia.edu/gpw. 19 January 2007. Background: National boundaries derived from the Gridded Population of the World (GPW) country-level land area grids at 2.5 arc-minute resolution. Permanent ice and all but large lakes have been merged with neighbouring polygons to make a layer more appropriate for cartographic visualization of the data. Does not include Antarctica.
U.S. states and territories (united_states_borders)
National Weather Service. 1999. States of the United States. Silver Spring, MD, USA: National Weather Service. Available at http://www.nws.noaa.gov/geodata/catalog/national/html/us_state.htm. 07 September 2006. Background: This data set is a polygon shapefile containing the states and territories of the United States including the continental U.S., Alaska, Hawaii and Atlantic and Pacific territories. It was created from USGS 1:2,000,000 DLG county data to provide the National Weather Service (NWS) with a state background data set for those applications and displays that require state boundaries.
Canadian provinces and territories (canadian_boundaries)
National Weather Service. 1999. Canadian provinces. Silver Spring, MD, USA: National Weather Service. Available at http://www.weather.gov/geodata/catalog/national/html/province.htm. 07 September 2006. Background: This data set is a polygon shapefile containing the provinces and territories of Canada.
x/y grid (in meters) (x_y_grid_laea)
This layer displays an x/y grid in meters for the lambert azimuthal equal-area projection used in the Atlas of the Cryosphere web interface. This rectangular coordinate system shows the planar distance in meters from the map projection origin in the x and y dimensions. The distances are displayed in exponential notation: e.g. 2.5e+06, which is the same as 2.5x10^6 or 2,500,000 meters. The map origin is at the North Pole (90° ) in this case, so x values above this position on the map are positive and those below it are negative; similarly, y values to the right of the North Pole are positive while those to the left are negative. The maximum extent (min x, min y, max x, max y) is: -9036842.762 m, -9036842.762 m, 9036842.762 m, 9036842.762 m.
x/y grid (in meters) (x_y_grid_epsg32661)
This layer displays an x/y grid in meters for the polar stereographic projection defined by EPSG 32661, available in the Web Map Service (WMS) for the Atlas of the Cryosphere. This rectangular coordinate system shows the planar distance in meters from the map projection origin in the x and y dimensions. The distances are displayed in exponential notation: e.g. 2.5e+06, which is the same as 2.5x10^6 or 2,500,000 meters. The map origin is near the southern tip of Greenland in this case, so x values above this position on the map are positive and those below it are negative; similarly, y values to the right of this point are positive while those to the left are negative. The maximum extent (min x, min y, max x, max y) is: -10700000 m, -10700000 m, 14700000 m, 14700000 m.
latitude/longitude grid (graticule) (lat_long_grid)
The latitude/longitude grid (a.k.a. graticule) is provided at three resolutions depending on the current map scale: 20° (lat_long_grid_20), 10° (lat_long_grid_10), and 5° (lat_long_grid_5). Citations are provided for each of these layers below.
latitude/longitude grid (graticule) (20°) (lat_long_grid_20)
Environmental Systems Research Institute, Inc. (ESRI). 2000. Graticule. Series: ESRI Data & Maps. Redlands, CA, USA: Environmental Systems Research Institute, Inc. (ESRI). Available at http://webgis.wr.usgs.gov/globalgis/. 01 February 2001.
latitude/longitude grid (graticule) (10°) (lat_long_grid_10)
Environmental Systems Research Institute, Inc. (ESRI). 2000. Graticule. Series: ESRI Data & Maps. Redlands, CA, USA: Environmental Systems Research Institute, Inc. (ESRI). Available at http://webgis.wr.usgs.gov/globalgis/. 01 February 2001.
latitude/longitude grid (graticule) (5°) (lat_long_grid_5)
Environmental Systems Research Institute, Inc. (ESRI). 2000. Graticule. Series: ESRI Data & Maps. Redlands, CA, USA: Environmental Systems Research Institute, Inc. (ESRI). Available at http://webgis.wr.usgs.gov/globalgis/. 01 February 2001.
Arctic Circle (arctic_circle)
The Arctic Circle is the line of latitude 66°34'N (often taken as 66.5°N). Along this line, the sun does not set on the day of the summer solstice, and does not rise on the day of the winter solstice. It is defined here as 66.56°N.
Tropic of Cancer (tropic_of_cancer)
The Tropic of Cancer is the northern parallel of maximum solar declination, approximately 23°27'N latitude. It is the farthest northern latitude at which the sun can appear directly overhead, which occurs on the day of the summer solstice. It is defined here as 23.44°N.
Equator (equator)
The Equator is the line of latitude 0°, which is equidistant from the poles, and which separates the Northern Hemisphere from the Southern Hemisphere.
International Date Line (international_date_line)
National Geographic Society. 1992. National Geographic Atlas of the World, Revised Sixth Edition. Washington, D.C. USA: National Geographic Society. Compiled by J. Maurer. 2007. Boulder, Colorado USA: National Snow and Ice Data Center. Digital Media. Background: The International Date Line (IDL), also known as just the Date Line, is an imaginary line on the surface of the Earth opposite the Prime Meridian which offsets the date as one travels east or west across it. Roughly along 180 deg longitude, with diversions to pass around some territories and island groups, it corresponds to the time zone boundary separating +12 and -12 hours GMT (UT1). Crossing the IDL travelling east results in a day or 24 hours being subtracted, and crossing west results in a day being added.
Prime Meridian (prime_meridian)
The Prime Meridian is the 0 degree line of longitude, which separates the Western Hemisphere from the Eastern Hemisphere.
cities (major_cities)
Labels for the world's major cities. Cities in Greenland not included in the global layer from ESRI are added separately. Information is provided for each of these layers below.
cities (global) (major_cities_global)
Environmental Systems Research Institute, Inc. (ESRI). 2000. World Cities. Series: ESRI Data & Maps. Redlands, CA, USA: Environmental Systems Research Institute, Inc. (ESRI). Available at http://webgis.wr.usgs.gov/globalgis/. 01 February 2001. Background: Locations and lables for the world's major cities.
cities (Greenland) (greenland_cities)
Locations of major Greenland cities not included in ESRI's World Cities data set.
geographic features: water bodies (geographic_features_sea)
Labels for locations (gazetteer) of major bodies of water in the Northern Hemisphere, including oceans, seas, gulfs, bays, straits, and some lakes.
geographic features: ice (geographic_features_ice)
Labels for locations (gazetteer) of major ice-related features in the Northern Hemisphere, including glaciers, ice caps, ice fields, ice shelves, and the Greenland ice sheet.
geographic features: land (geographic_features_land)
Labels for locations (gazetteer) of major land-related features in the Northern Hemisphere, including mountain ranges, islands, and other features.
North Poles (north_poles)
Labels the location of various types of North Poles: geographic, geomagnetic, magnetic, pole of cold, and pole of inaccessibility.
North Pole, Geographic (north_pole_geographic)
Labels the location of the North Pole (90 deg N, 0 deg), also referred to as the Geographic North Pole.
North Pole, Magnetic (north_pole_magnetic)
Geological Survey of Canada. 31 December 2005. Geomagnetism - North Magnetic Pole. Geological Survey of Canada. http://gsc.nrcan.gc.ca/geomag/nmp/northpole_e.php. 23 January 2007. Background: Labels the location of the Magnetic North Pole, which in 2005 was measured at 82.7 deg N, 114.4 deg W by the Geological Survey of Canada. The Earth's magnetic poles are the two points on the earth's surface at which magnetic meridians converge; the horizontal component of the magnetic field of the earth becomes zero at this point; also called the dip pole. The magnetic poles migrate over time.
North Pole, Geomagnetic (north_pole_geomagnetic)
World Data Center for Geomagnetism, Kyoto. Date unknown. Magnetic North, Geomagnetic and Magnetic Poles. World Data Center for Geomagnetism, Kyoto. http://swdcwww.kugi.kyoto-u.ac.jp/poles/polesexp.html. 23 January 2007. Background: Labels the location of the Geomagnetic North Pole, which in 2005 was measured at 79.7 deg N, 71.8 deg W by the World Data Center for Geomagnetism, Kyoto. The Earth's geomagnetic poles are the points of intersection of the Earth's surface with the axis of a simple magnetic dipole that best approximates the Earth's actual, more complex magnetic field. If the Earth's magnetic field were a perfect dipole, then the field lines would be vertical at the geomagnetic poles and they would therefore coincide with the magnetic poles: however, the dipole approximation is in fact far from perfect, so in reality the magnetic and geomagnetic poles lie some distance apart. The geomagnetic poles migrate over time.
North Pole of Inaccessibility (north_pole_inaccessibility)
Scambos, T. and T. Haran. 2005. Location of the Arctic Pole of Inaccessibility computed from MODIS remote sensing imagery and GPS. Boulder, CO, USA: National Snow and Ice Data Center. Unpublished. Background: Labels the location of the North Pole of Inaccessibility (85.780 deg N, 176.145 deg E), which is the point in the Arctic Ocean farthest from land. Distances were triangulated on a polar stereographic projection using remote sensing imagery from the Moderate-Resolution Imaging Spectroradiometer (MODIS) instrument that were geolocated by the associated MOD03 MODIS geolocation product. Once this process converged on the location that was farthest from any coast or island and nearly equidistant from three disparate coastal points, a Global Positioning System (GPS) instrument was then used to convert this point from its projected geometry to an ellipsoidal geometry. This Pole of Inaccessibility is more accurate than the one traditionally referred to in maps used during a flight by Sir Hubert Wilkins in 1926 (85.05 deg N, 174.85 deg E) where he tried to guess the center of the summer sea ice pack, a highly variable location.
North Pole of Cold (north_pole_of_cold)
Wikipedia contributors. 23 January 2007. Pole of Cold. Wikipedia, The Free Encyclopedia. Available at http://en.wikipedia.org/w/index.php?title=Pole_of_Cold&oldid=102629381. 24 January 2007. Background: The Poles of Cold are the places in the Northern and Southern hemispheres where the lowest air temperature was recorded. In December of 1868 and then in February of 1869 I. A. Khudyakov made the discovery of the Northern Pole of Cold by measuring a record temperature of -63.2°C (-82°F) in Verkhoyansk, Siberia (67.55°N, 133.38°E).
North Poles (north_poles_wfs)
Labels the location of various types of North Poles: geographic, geomagnetic, magnetic, pole of cold, and pole of inaccessibility. Citations: World Data Center for Geomagnetism, Kyoto. Date unknown. Magnetic North, Geomagnetic and Magnetic Poles. World Data Center for Geomagnetism, Kyoto. Available at http://swdcwww.kugi.kyoto-u.ac.jp/poles/polesexp.html. Accessed 23 January 2007; Geological Survey of Canada. 31 December 2005. Geomagnetism - North Magnetic Pole. Geological Survey of Canada. Available at http://gsc.nrcan.gc.ca/geomag/nmp/northpole_e.php. Accessed 23 January 2007; Wikipedia contributors. 23 January 2007. Pole of Cold. Wikipedia, The Free Encyclopedia. Available at http://en.wikipedia.org/wiki/Pole_of_Cold. Accessed 24 January 2007; Scambos, T. and T. Haran. 2005. Location of the Arctic Pole of Inaccessibility computed from MODIS remote sensing imagery and GPS. Boulder, Colorado USA: National Snow and Ice Data Center.
Greenland Climate Network (greenland_climate_network)
Steffen, K. 03 June 2002. Greenland Climate Network (GC-Net). Cooperative Institute for Research in Environmental Sciences. Automatic Weather Station (AWS) positions available at http://cires.colorado.edu/science/groups/steffen/gcnet/GC-Net_info.txt. 23 January 2007. Background: This layer labels the location of automatic weather stations (AWS) that are part of the Greenland Climate Network (GC-Net). A total of ~20 GC-Net AWS have been installed across Greenland since 1995 (Steffen and Box, 2001) as part of NASA's Program for Arctic Regional Climate Assessment (PARCA). Installed and maintained by Dr. Konrad Steffen and others, the GC-Net provides critical climate information over vast, unpopulated regions of the Greenland ice sheet. Each AWS is equipped with a number of instruments to sample the following: air temperature, wind speed, wind direction, humidity, pressure, accumulation rate at high temporal resolution to identify and resolve individual storms, surface radiation balance in visible and infrared wavelengths, sensible and latent heat flux fluxes, and snowpack conductive heat fluxes. To download GC-Net data, visit 'http://cires.colorado.edu/science/groups/steffen/gcnet/'.
Greenland ice core locations (greenland_ice_cores)
Maurer, J. compiler. 2009. Deep ice core locations. Boulder, Colorado USA: National Snow and Ice Data Center. Digital media. Accessed 03 May 2009. Background: Labels the locations of several deep ice cores from the Greenland ice sheet, including: the Greenland Ice Sheet Project (GISP) Dye 3; the Greenland Ice Sheet Project 2 (GISP2); the Greenland Ice Core Project (GRIP); the North Greenland Ice Core Project (NGRIP); Camp Century; Crete; and Milcent ice core.
copyright (copyright)
Provides the text 'National Snow and Ice Data Center' to the lower-left-hand portion of the map to help identify NSIDC as the source of the Atlas of the Cryosphere map server. All maps, data, and information contained in the Atlas of the Cryosphere are public domain unless specifically stated otherwise. Proper citation and acknowledgement is requested: an example citation for each data source is provided at 'http://nsidc.org/data/atlas/cryosphere_atlas_north_info.html'.
There are currently no notifications for the service, click the feed icon to subscribe.