National Snow and Ice Data Center |
|
Atlas of the Cryosphere: Southern Hemisphere
| Service health Now: |
|---|
- Interface
- Web Service, OGC Web Map Service 1.1.1
- Keywords
- Antarctica, Cryosphere, Earth Science, Glaciers, Ice Extent, Ice Sheets, Oceans, Polar, Sea Ice, Sea Ice Concentration, Snow/Ice, Snow Cover, Snow Water Equivalent, Southern Hemisphere
- Fees
- none
- Access constraints
- none
- Data provider
-
National Snow and Ice Data Center (unverified)
Contact information:
NSIDC User Services
National Snow and Ice Data Center
mailing:
CIRES, 449 UCB, University of Colorado, 80309-0449 Boulder, USAEmail:
Phone: +1 303.492.6199
Ads by Google
The National Snow and Ice Data Center (NSIDC) Atlas of the Cryosphere is a map server that provides data and information pertinent to the frozen regions of Earth, including monthly climatologies of sea ice extent and concentration, snow cover extent, and snow water equivalent, in addition to glacier outlines, ice sheet elevation and accumulation, and more. In order to support polar projections, the Atlas is divided into two separate map servers: one for the Northern Hemisphere and one for the Southern Hemisphere. In addition to providing map images and source data through Open Geospatial Consortium, Inc. (OGC) protocols (WMS, WFS, and WCS), a dynamic web interface for exploring these data is also available at http://nsidc.org/data/atlas. If you have questions, comments or suggestions, please contact NSIDC User Services at +1.303.492.6199 or nsidc@nsidc.org. The development of this map server application was supported by NASA's Earth Observing System (EOS) Program under contract NAS5-03099 and was developed using MapServer, an Open Source development environment for building spatially-enabled internet applications. To cite the Atlas of the Cryosphere: Maurer, J. 2007. Atlas of the Cryosphere. Boulder, Colorado USA: National Snow and Ice Data Center. Digital media. Available at http://nsidc.org/data/atlas/.
Available map layers (195)
Atlas of the Cryosphere: Southern Hemisphere (cryosphere_atlas_south)
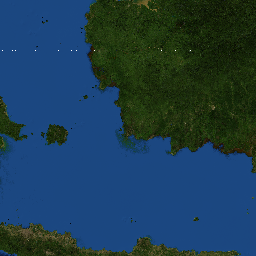
satellite imagery, January (2004) (blue_marble_01)
Stockli, R, Vermote, E., Saleous, N., Simmon R., and D. Herring. 2005. The Blue Marble Next Generation - A true color earth dataset including seasonal dynamics from MODIS. Greenbelt, Maryland USA: NASA Earth Observatory. Digital media. Available at ftp://sidads.colorado.edu/pub/DATASETS/BM/ and http://visibleearth.nasa.gov/view_set.php?categoryID=2355. Accessed 12 September 2007. Background: Cloud-free satellite image mosaic at 500-meter resolution compiled from NASA's Moderate-Resolution Imaging Spectroradiometer (MODIS) spaceborne remote sensing instrument for the month of January in 2004. Included in this data set is topographic and bathymetric relief shading from the Shuttle Radar Topography Mission (SRTM), GTOPO30, Radarsat Antarctic Mapping Project (RAMP) Digital Elevation Model (DEM) Version 2, and the General Bathymetric Chart of the Oceans (GEBCO).
satellite imagery, January (2004) (blue_marble_01_circle)
Stockli, R, Vermote, E., Saleous, N., Simmon R., and D. Herring. 2005. The Blue Marble Next Generation - A true color earth dataset including seasonal dynamics from MODIS. Greenbelt, Maryland USA: NASA Earth Observatory. Digital media. Available at ftp://sidads.colorado.edu/pub/DATASETS/BM/ and http://visibleearth.nasa.gov/view_set.php?categoryID=2355. Accessed 12 September 2007. Background: Cloud-free satellite image mosaic at 500-meter resolution compiled from NASA's Moderate-Resolution Imaging Spectroradiometer (MODIS) spaceborne remote sensing instrument for the month of January in 2004. Included in this data set is topographic and bathymetric relief shading from the Shuttle Radar Topography Mission (SRTM), GTOPO30, Radarsat Antarctic Mapping Project (RAMP) Digital Elevation Model (DEM) Version 2, and the General Bathymetric Chart of the Oceans (GEBCO). This layer only shows the imagery from the Southern Hemisphere, which has the appearance of a circle in a polar projection.
satellite imagery, July (2004) (blue_marble_07)
Stockli, R, Vermote, E., Saleous, N., Simmon R., and D. Herring. 2005. The Blue Marble Next Generation - A true color earth dataset including seasonal dynamics from MODIS. Greenbelt, Maryland USA: NASA Earth Observatory. Digital media. Available at ftp://sidads.colorado.edu/pub/DATASETS/BM/ and http://visibleearth.nasa.gov/view_set.php?categoryID=2355. Accessed 12 September 2007. Background: Cloud-free satellite image mosaic at 500-meter resolution compiled from NASA's Moderate-Resolution Imaging Spectroradiometer (MODIS) spaceborne remote sensing instrument for the month of July in 2004. Included in this data set is topographic and bathymetric relief shading from the Shuttle Radar Topography Mission (SRTM), GTOPO30, Radarsat Antarctic Mapping Project (RAMP) Digital Elevation Model (DEM) Version 2, and the General Bathymetric Chart of the Oceans (GEBCO).
satellite imagery, July (2004) (blue_marble_07_circle)
Stockli, R, Vermote, E., Saleous, N., Simmon R., and D. Herring. 2005. The Blue Marble Next Generation - A true color earth dataset including seasonal dynamics from MODIS. Greenbelt, Maryland USA: NASA Earth Observatory. Digital media. Available at ftp://sidads.colorado.edu/pub/DATASETS/BM/ and http://visibleearth.nasa.gov/view_set.php?categoryID=2355. Accessed 12 September 2007. Background: Cloud-free satellite image mosaic at 500-meter resolution compiled from NASA's Moderate-Resolution Imaging Spectroradiometer (MODIS) spaceborne remote sensing instrument for the month of July in 2004. Included in this data set is topographic and bathymetric relief shading from the Shuttle Radar Topography Mission (SRTM), GTOPO30, Radarsat Antarctic Mapping Project (RAMP) Digital Elevation Model (DEM) Version 2, and the General Bathymetric Chart of the Oceans (GEBCO). This layer only shows the imagery from the Southern Hemisphere, which has the appearance of a circle in a polar projection.
sea ice extent, January (1979-2007) (sea_ice_extent_01)
Stroeve, J. and W. Meier. 1999, updated 2008. Sea Ice Trends and Climatologies from SMMR and SSM/I. Boulder, Colorado USA: National Snow and Ice Data Center. Digital media. Available at http://nsidc.org/data/smmr_ssmi_ancillary/monthly_means.html. Accessed 27 June 2008. Compiled from: Cavalieri, D., C. Parkinson, P. Gloersen, and H. J. Zwally. 1996. Sea ice concentrations from Nimbus-7 SMMR and DMSP SSM/I passive microwave data. Boulder, Colorado USA: National Snow and Ice Data Center. Digital media. Available at http://nsidc.org/data/nsidc-0051.html. Background: Sea ice extent includes all areas where sea ice concentration is greater than or equal to 15%. Monthly climatologies of sea ice concentration represent mean ice concentration percentages for each month over the entire time period 1979-2007, which is generated from passive microwave brightness temperature data derived from Nimbus-7 Scanning Multichannel Microwave Radiometer (SMMR) and Defense Meteorological Satellite Program (DMSP) -F8, -F11 and -F13 Special Sensor Microwave/Imager (SSM/I) radiances at a grid cell size of 25 x 25 km using the NASA Team algorithm developed by the Oceans and Ice Branch, Laboratory for Hydrospheric Processes at NASA Goddard Space Flight Center (GSFC).
sea ice extent, February (1979-2007) (sea_ice_extent_02)
Stroeve, J. and W. Meier. 1999, updated 2008. Sea Ice Trends and Climatologies from SMMR and SSM/I. Boulder, Colorado USA: National Snow and Ice Data Center. Digital media. Available at http://nsidc.org/data/smmr_ssmi_ancillary/monthly_means.html. Accessed 27 June 2008. Compiled from: Cavalieri, D., C. Parkinson, P. Gloersen, and H. J. Zwally. 1996. Sea ice concentrations from Nimbus-7 SMMR and DMSP SSM/I passive microwave data. Boulder, Colorado USA: National Snow and Ice Data Center. Digital media. Available at http://nsidc.org/data/nsidc-0051.html. Background: Sea ice extent includes all areas where sea ice concentration is greater than or equal to 15%. Monthly climatologies of sea ice concentration represent mean ice concentration percentages for each month over the entire time period 1979-2007, which is generated from passive microwave brightness temperature data derived from Nimbus-7 Scanning Multichannel Microwave Radiometer (SMMR) and Defense Meteorological Satellite Program (DMSP) -F8, -F11 and -F13 Special Sensor Microwave/Imager (SSM/I) radiances at a grid cell size of 25 x 25 km using the NASA Team algorithm developed by the Oceans and Ice Branch, Laboratory for Hydrospheric Processes at NASA Goddard Space Flight Center (GSFC).
sea ice extent, March (1979-2007) (sea_ice_extent_03)
Stroeve, J. and W. Meier. 1999, updated 2008. Sea Ice Trends and Climatologies from SMMR and SSM/I. Boulder, Colorado USA: National Snow and Ice Data Center. Digital media. Available at http://nsidc.org/data/smmr_ssmi_ancillary/monthly_means.html. Accessed 27 June 2008. Compiled from: Cavalieri, D., C. Parkinson, P. Gloersen, and H. J. Zwally. 1996. Sea ice concentrations from Nimbus-7 SMMR and DMSP SSM/I passive microwave data. Boulder, Colorado USA: National Snow and Ice Data Center. Digital media. Available at http://nsidc.org/data/nsidc-0051.html. Background: Sea ice extent includes all areas where sea ice concentration is greater than or equal to 15%. Monthly climatologies of sea ice concentration represent mean ice concentration percentages for each month over the entire time period 1979-2007, which is generated from passive microwave brightness temperature data derived from Nimbus-7 Scanning Multichannel Microwave Radiometer (SMMR) and Defense Meteorological Satellite Program (DMSP) -F8, -F11 and -F13 Special Sensor Microwave/Imager (SSM/I) radiances at a grid cell size of 25 x 25 km using the NASA Team algorithm developed by the Oceans and Ice Branch, Laboratory for Hydrospheric Processes at NASA Goddard Space Flight Center (GSFC).
sea ice extent, April (1979-2007) (sea_ice_extent_04)
Stroeve, J. and W. Meier. 1999, updated 2008. Sea Ice Trends and Climatologies from SMMR and SSM/I. Boulder, Colorado USA: National Snow and Ice Data Center. Digital media. Available at http://nsidc.org/data/smmr_ssmi_ancillary/monthly_means.html. Accessed 27 June 2008. Compiled from: Cavalieri, D., C. Parkinson, P. Gloersen, and H. J. Zwally. 1996. Sea ice concentrations from Nimbus-7 SMMR and DMSP SSM/I passive microwave data. Boulder, Colorado USA: National Snow and Ice Data Center. Digital media. Available at http://nsidc.org/data/nsidc-0051.html. Background: Sea ice extent includes all areas where sea ice concentration is greater than or equal to 15%. Monthly climatologies of sea ice concentration represent mean ice concentration percentages for each month over the entire time period 1979-2007, which is generated from passive microwave brightness temperature data derived from Nimbus-7 Scanning Multichannel Microwave Radiometer (SMMR) and Defense Meteorological Satellite Program (DMSP) -F8, -F11 and -F13 Special Sensor Microwave/Imager (SSM/I) radiances at a grid cell size of 25 x 25 km using the NASA Team algorithm developed by the Oceans and Ice Branch, Laboratory for Hydrospheric Processes at NASA Goddard Space Flight Center (GSFC).
sea ice extent, May (1979-2007) (sea_ice_extent_05)
Stroeve, J. and W. Meier. 1999, updated 2008. Sea Ice Trends and Climatologies from SMMR and SSM/I. Boulder, Colorado USA: National Snow and Ice Data Center. Digital media. Available at http://nsidc.org/data/smmr_ssmi_ancillary/monthly_means.html. Accessed 27 June 2008. Compiled from: Cavalieri, D., C. Parkinson, P. Gloersen, and H. J. Zwally. 1996. Sea ice concentrations from Nimbus-7 SMMR and DMSP SSM/I passive microwave data. Boulder, Colorado USA: National Snow and Ice Data Center. Digital media. Available at http://nsidc.org/data/nsidc-0051.html. Background: Sea ice extent includes all areas where sea ice concentration is greater than or equal to 15%. Monthly climatologies of sea ice concentration represent mean ice concentration percentages for each month over the entire time period 1979-2007, which is generated from passive microwave brightness temperature data derived from Nimbus-7 Scanning Multichannel Microwave Radiometer (SMMR) and Defense Meteorological Satellite Program (DMSP) -F8, -F11 and -F13 Special Sensor Microwave/Imager (SSM/I) radiances at a grid cell size of 25 x 25 km using the NASA Team algorithm developed by the Oceans and Ice Branch, Laboratory for Hydrospheric Processes at NASA Goddard Space Flight Center (GSFC).
sea ice extent, June (1979-2007) (sea_ice_extent_06)
Stroeve, J. and W. Meier. 1999, updated 2008. Sea Ice Trends and Climatologies from SMMR and SSM/I. Boulder, Colorado USA: National Snow and Ice Data Center. Digital media. Available at http://nsidc.org/data/smmr_ssmi_ancillary/monthly_means.html. Accessed 27 June 2008. Compiled from: Cavalieri, D., C. Parkinson, P. Gloersen, and H. J. Zwally. 1996. Sea ice concentrations from Nimbus-7 SMMR and DMSP SSM/I passive microwave data. Boulder, Colorado USA: National Snow and Ice Data Center. Digital media. Available at http://nsidc.org/data/nsidc-0051.html. Background: Sea ice extent includes all areas where sea ice concentration is greater than or equal to 15%. Monthly climatologies of sea ice concentration represent mean ice concentration percentages for each month over the entire time period 1979-2007, which is generated from passive microwave brightness temperature data derived from Nimbus-7 Scanning Multichannel Microwave Radiometer (SMMR) and Defense Meteorological Satellite Program (DMSP) -F8, -F11 and -F13 Special Sensor Microwave/Imager (SSM/I) radiances at a grid cell size of 25 x 25 km using the NASA Team algorithm developed by the Oceans and Ice Branch, Laboratory for Hydrospheric Processes at NASA Goddard Space Flight Center (GSFC).
sea ice extent, July (1979-2007) (sea_ice_extent_07)
Stroeve, J. and W. Meier. 1999, updated 2008. Sea Ice Trends and Climatologies from SMMR and SSM/I. Boulder, Colorado USA: National Snow and Ice Data Center. Digital media. Available at http://nsidc.org/data/smmr_ssmi_ancillary/monthly_means.html. Accessed 27 June 2008. Compiled from: Cavalieri, D., C. Parkinson, P. Gloersen, and H. J. Zwally. 1996. Sea ice concentrations from Nimbus-7 SMMR and DMSP SSM/I passive microwave data. Boulder, Colorado USA: National Snow and Ice Data Center. Digital media. Available at http://nsidc.org/data/nsidc-0051.html. Background: Sea ice extent includes all areas where sea ice concentration is greater than or equal to 15%. Monthly climatologies of sea ice concentration represent mean ice concentration percentages for each month over the entire time period 1979-2007, which is generated from passive microwave brightness temperature data derived from Nimbus-7 Scanning Multichannel Microwave Radiometer (SMMR) and Defense Meteorological Satellite Program (DMSP) -F8, -F11 and -F13 Special Sensor Microwave/Imager (SSM/I) radiances at a grid cell size of 25 x 25 km using the NASA Team algorithm developed by the Oceans and Ice Branch, Laboratory for Hydrospheric Processes at NASA Goddard Space Flight Center (GSFC).
sea ice extent, August (1979-2007) (sea_ice_extent_08)
Stroeve, J. and W. Meier. 1999, updated 2008. Sea Ice Trends and Climatologies from SMMR and SSM/I. Boulder, Colorado USA: National Snow and Ice Data Center. Digital media. Available at http://nsidc.org/data/smmr_ssmi_ancillary/monthly_means.html. Accessed 27 June 2008. Compiled from: Cavalieri, D., C. Parkinson, P. Gloersen, and H. J. Zwally. 1996. Sea ice concentrations from Nimbus-7 SMMR and DMSP SSM/I passive microwave data. Boulder, Colorado USA: National Snow and Ice Data Center. Digital media. Available at http://nsidc.org/data/nsidc-0051.html. Background: Sea ice extent includes all areas where sea ice concentration is greater than or equal to 15%. Monthly climatologies of sea ice concentration represent mean ice concentration percentages for each month over the entire time period 1979-2007, which is generated from passive microwave brightness temperature data derived from Nimbus-7 Scanning Multichannel Microwave Radiometer (SMMR) and Defense Meteorological Satellite Program (DMSP) -F8, -F11 and -F13 Special Sensor Microwave/Imager (SSM/I) radiances at a grid cell size of 25 x 25 km using the NASA Team algorithm developed by the Oceans and Ice Branch, Laboratory for Hydrospheric Processes at NASA Goddard Space Flight Center (GSFC).
sea ice extent, September (1979-2007) (sea_ice_extent_09)
Stroeve, J. and W. Meier. 1999, updated 2008. Sea Ice Trends and Climatologies from SMMR and SSM/I. Boulder, Colorado USA: National Snow and Ice Data Center. Digital media. Available at http://nsidc.org/data/smmr_ssmi_ancillary/monthly_means.html. Accessed 27 June 2008. Compiled from: Cavalieri, D., C. Parkinson, P. Gloersen, and H. J. Zwally. 1996. Sea ice concentrations from Nimbus-7 SMMR and DMSP SSM/I passive microwave data. Boulder, Colorado USA: National Snow and Ice Data Center. Digital media. Available at http://nsidc.org/data/nsidc-0051.html. Background: Sea ice extent includes all areas where sea ice concentration is greater than or equal to 15%. Monthly climatologies of sea ice concentration represent mean ice concentration percentages for each month over the entire time period 1979-2007, which is generated from passive microwave brightness temperature data derived from Nimbus-7 Scanning Multichannel Microwave Radiometer (SMMR) and Defense Meteorological Satellite Program (DMSP) -F8, -F11 and -F13 Special Sensor Microwave/Imager (SSM/I) radiances at a grid cell size of 25 x 25 km using the NASA Team algorithm developed by the Oceans and Ice Branch, Laboratory for Hydrospheric Processes at NASA Goddard Space Flight Center (GSFC).
sea ice extent, October (1979-2007) (sea_ice_extent_10)
Stroeve, J. and W. Meier. 1999, updated 2008. Sea Ice Trends and Climatologies from SMMR and SSM/I. Boulder, Colorado USA: National Snow and Ice Data Center. Digital media. Available at http://nsidc.org/data/smmr_ssmi_ancillary/monthly_means.html. Accessed 27 June 2008. Compiled from: Cavalieri, D., C. Parkinson, P. Gloersen, and H. J. Zwally. 1996. Sea ice concentrations from Nimbus-7 SMMR and DMSP SSM/I passive microwave data. Boulder, Colorado USA: National Snow and Ice Data Center. Digital media. Available at http://nsidc.org/data/nsidc-0051.html. Background: Sea ice extent includes all areas where sea ice concentration is greater than or equal to 15%. Monthly climatologies of sea ice concentration represent mean ice concentration percentages for each month over the entire time period 1979-2007, which is generated from passive microwave brightness temperature data derived from Nimbus-7 Scanning Multichannel Microwave Radiometer (SMMR) and Defense Meteorological Satellite Program (DMSP) -F8, -F11 and -F13 Special Sensor Microwave/Imager (SSM/I) radiances at a grid cell size of 25 x 25 km using the NASA Team algorithm developed by the Oceans and Ice Branch, Laboratory for Hydrospheric Processes at NASA Goddard Space Flight Center (GSFC).
sea ice extent, November (1979-2007) (sea_ice_extent_11)
Stroeve, J. and W. Meier. 1999, updated 2008. Sea Ice Trends and Climatologies from SMMR and SSM/I. Boulder, Colorado USA: National Snow and Ice Data Center. Digital media. Available at http://nsidc.org/data/smmr_ssmi_ancillary/monthly_means.html. Accessed 27 June 2008. Compiled from: Cavalieri, D., C. Parkinson, P. Gloersen, and H. J. Zwally. 1996. Sea ice concentrations from Nimbus-7 SMMR and DMSP SSM/I passive microwave data. Boulder, Colorado USA: National Snow and Ice Data Center. Digital media. Available at http://nsidc.org/data/nsidc-0051.html. Background: Sea ice extent includes all areas where sea ice concentration is greater than or equal to 15%. Monthly climatologies of sea ice concentration represent mean ice concentration percentages for each month over the entire time period 1979-2007, which is generated from passive microwave brightness temperature data derived from Nimbus-7 Scanning Multichannel Microwave Radiometer (SMMR) and Defense Meteorological Satellite Program (DMSP) -F8, -F11 and -F13 Special Sensor Microwave/Imager (SSM/I) radiances at a grid cell size of 25 x 25 km using the NASA Team algorithm developed by the Oceans and Ice Branch, Laboratory for Hydrospheric Processes at NASA Goddard Space Flight Center (GSFC).
sea ice extent, December (1979-2007) (sea_ice_extent_12)
Stroeve, J. and W. Meier. 1999, updated 2008. Sea Ice Trends and Climatologies from SMMR and SSM/I. Boulder, Colorado USA: National Snow and Ice Data Center. Digital media. Available at http://nsidc.org/data/smmr_ssmi_ancillary/monthly_means.html. Accessed 27 June 2008. Compiled from: Cavalieri, D., C. Parkinson, P. Gloersen, and H. J. Zwally. 1996. Sea ice concentrations from Nimbus-7 SMMR and DMSP SSM/I passive microwave data. Boulder, Colorado USA: National Snow and Ice Data Center. Digital media. Available at http://nsidc.org/data/nsidc-0051.html. Background: Sea ice extent includes all areas where sea ice concentration is greater than or equal to 15%. Monthly climatologies of sea ice concentration represent mean ice concentration percentages for each month over the entire time period 1979-2007, which is generated from passive microwave brightness temperature data derived from Nimbus-7 Scanning Multichannel Microwave Radiometer (SMMR) and Defense Meteorological Satellite Program (DMSP) -F8, -F11 and -F13 Special Sensor Microwave/Imager (SSM/I) radiances at a grid cell size of 25 x 25 km using the NASA Team algorithm developed by the Oceans and Ice Branch, Laboratory for Hydrospheric Processes at NASA Goddard Space Flight Center (GSFC).
sea ice concentration, January (1979-2007) (sea_ice_concentration_01)
Stroeve, J. and W. Meier. 1999, updated 2008. Sea Ice Trends and Climatologies from SMMR and SSM/I. Boulder, Colorado USA: National Snow and Ice Data Center. Digital media. Available at http://nsidc.org/data/smmr_ssmi_ancillary/monthly_means.html. Accessed 27 June 2008. Compiled from: Cavalieri, D., C. Parkinson, P. Gloersen, and H. J. Zwally. 1996. Sea ice concentrations from Nimbus-7 SMMR and DMSP SSM/I passive microwave data. Boulder, Colorado USA: National Snow and Ice Data Center. Digital media. Available at http://nsidc.org/data/nsidc-0051.html. Background: Monthly climatologies of sea ice concentration represent mean ice concentration percentages for each month over the entire time period 1979-2007, which is generated from passive microwave brightness temperature data derived from Nimbus-7 Scanning Multichannel Microwave Radiometer (SMMR) and Defense Meteorological Satellite Program (DMSP) -F8, -F11 and -F13 Special Sensor Microwave/Imager (SSM/I) radiances at a grid cell size of 25 x 25 km using the NASA Team algorithm developed by the Oceans and Ice Branch, Laboratory for Hydrospheric Processes at NASA Goddard Space Flight Center (GSFC). A threshold of 15 percent concentration has been applied to the monthly climatologies.
sea ice concentration, February (1979-2007) (sea_ice_concentration_02)
Stroeve, J. and W. Meier. 1999, updated 2008. Sea Ice Trends and Climatologies from SMMR and SSM/I. Boulder, Colorado USA: National Snow and Ice Data Center. Digital media. Available at http://nsidc.org/data/smmr_ssmi_ancillary/monthly_means.html. Accessed 27 June 2008. Compiled from: Cavalieri, D., C. Parkinson, P. Gloersen, and H. J. Zwally. 1996. Sea ice concentrations from Nimbus-7 SMMR and DMSP SSM/I passive microwave data. Boulder, Colorado USA: National Snow and Ice Data Center. Digital media. Available at http://nsidc.org/data/nsidc-0051.html. Background: Monthly climatologies of sea ice concentration represent mean ice concentration percentages for each month over the entire time period 1979-2007, which is generated from passive microwave brightness temperature data derived from Nimbus-7 Scanning Multichannel Microwave Radiometer (SMMR) and Defense Meteorological Satellite Program (DMSP) -F8, -F11 and -F13 Special Sensor Microwave/Imager (SSM/I) radiances at a grid cell size of 25 x 25 km using the NASA Team algorithm developed by the Oceans and Ice Branch, Laboratory for Hydrospheric Processes at NASA Goddard Space Flight Center (GSFC). A threshold of 15 percent concentration has been applied to the monthly climatologies.
sea ice concentration, March (1979-2007) (sea_ice_concentration_03)
Stroeve, J. and W. Meier. 1999, updated 2008. Sea Ice Trends and Climatologies from SMMR and SSM/I. Boulder, Colorado USA: National Snow and Ice Data Center. Digital media. Available at http://nsidc.org/data/smmr_ssmi_ancillary/monthly_means.html. Accessed 27 June 2008. Compiled from: Cavalieri, D., C. Parkinson, P. Gloersen, and H. J. Zwally. 1996. Sea ice concentrations from Nimbus-7 SMMR and DMSP SSM/I passive microwave data. Boulder, Colorado USA: National Snow and Ice Data Center. Digital media. Available at http://nsidc.org/data/nsidc-0051.html. Background: Monthly climatologies of sea ice concentration represent mean ice concentration percentages for each month over the entire time period 1979-2007, which is generated from passive microwave brightness temperature data derived from Nimbus-7 Scanning Multichannel Microwave Radiometer (SMMR) and Defense Meteorological Satellite Program (DMSP) -F8, -F11 and -F13 Special Sensor Microwave/Imager (SSM/I) radiances at a grid cell size of 25 x 25 km using the NASA Team algorithm developed by the Oceans and Ice Branch, Laboratory for Hydrospheric Processes at NASA Goddard Space Flight Center (GSFC). A threshold of 15 percent concentration has been applied to the monthly climatologies.
sea ice concentration, April (1979-2007) (sea_ice_concentration_04)
Stroeve, J. and W. Meier. 1999, updated 2008. Sea Ice Trends and Climatologies from SMMR and SSM/I. Boulder, Colorado USA: National Snow and Ice Data Center. Digital media. Available at http://nsidc.org/data/smmr_ssmi_ancillary/monthly_means.html. Accessed 27 June 2008. Compiled from: Cavalieri, D., C. Parkinson, P. Gloersen, and H. J. Zwally. 1996. Sea ice concentrations from Nimbus-7 SMMR and DMSP SSM/I passive microwave data. Boulder, Colorado USA: National Snow and Ice Data Center. Digital media. Available at http://nsidc.org/data/nsidc-0051.html. Background: Monthly climatologies of sea ice concentration represent mean ice concentration percentages for each month over the entire time period 1979-2007, which is generated from passive microwave brightness temperature data derived from Nimbus-7 Scanning Multichannel Microwave Radiometer (SMMR) and Defense Meteorological Satellite Program (DMSP) -F8, -F11 and -F13 Special Sensor Microwave/Imager (SSM/I) radiances at a grid cell size of 25 x 25 km using the NASA Team algorithm developed by the Oceans and Ice Branch, Laboratory for Hydrospheric Processes at NASA Goddard Space Flight Center (GSFC). A threshold of 15 percent concentration has been applied to the monthly climatologies.
sea ice concentration, May (1979-2007) (sea_ice_concentration_05)
Stroeve, J. and W. Meier. 1999, updated 2008. Sea Ice Trends and Climatologies from SMMR and SSM/I. Boulder, Colorado USA: National Snow and Ice Data Center. Digital media. Available at http://nsidc.org/data/smmr_ssmi_ancillary/monthly_means.html. Accessed 27 June 2008. Compiled from: Cavalieri, D., C. Parkinson, P. Gloersen, and H. J. Zwally. 1996. Sea ice concentrations from Nimbus-7 SMMR and DMSP SSM/I passive microwave data. Boulder, Colorado USA: National Snow and Ice Data Center. Digital media. Available at http://nsidc.org/data/nsidc-0051.html. Background: Monthly climatologies of sea ice concentration represent mean ice concentration percentages for each month over the entire time period 1979-2007, which is generated from passive microwave brightness temperature data derived from Nimbus-7 Scanning Multichannel Microwave Radiometer (SMMR) and Defense Meteorological Satellite Program (DMSP) -F8, -F11 and -F13 Special Sensor Microwave/Imager (SSM/I) radiances at a grid cell size of 25 x 25 km using the NASA Team algorithm developed by the Oceans and Ice Branch, Laboratory for Hydrospheric Processes at NASA Goddard Space Flight Center (GSFC). A threshold of 15 percent concentration has been applied to the monthly climatologies.
sea ice concentration, June (1979-2007) (sea_ice_concentration_06)
Stroeve, J. and W. Meier. 1999, updated 2008. Sea Ice Trends and Climatologies from SMMR and SSM/I. Boulder, Colorado USA: National Snow and Ice Data Center. Digital media. Available at http://nsidc.org/data/smmr_ssmi_ancillary/monthly_means.html. Accessed 27 June 2008. Compiled from: Cavalieri, D., C. Parkinson, P. Gloersen, and H. J. Zwally. 1996. Sea ice concentrations from Nimbus-7 SMMR and DMSP SSM/I passive microwave data. Boulder, Colorado USA: National Snow and Ice Data Center. Digital media. Available at http://nsidc.org/data/nsidc-0051.html. Background: Monthly climatologies of sea ice concentration represent mean ice concentration percentages for each month over the entire time period 1979-2007, which is generated from passive microwave brightness temperature data derived from Nimbus-7 Scanning Multichannel Microwave Radiometer (SMMR) and Defense Meteorological Satellite Program (DMSP) -F8, -F11 and -F13 Special Sensor Microwave/Imager (SSM/I) radiances at a grid cell size of 25 x 25 km using the NASA Team algorithm developed by the Oceans and Ice Branch, Laboratory for Hydrospheric Processes at NASA Goddard Space Flight Center (GSFC). A threshold of 15 percent concentration has been applied to the monthly climatologies.
sea ice concentration, July (1979-2007) (sea_ice_concentration_07)
Stroeve, J. and W. Meier. 1999, updated 2008. Sea Ice Trends and Climatologies from SMMR and SSM/I. Boulder, Colorado USA: National Snow and Ice Data Center. Digital media. Available at http://nsidc.org/data/smmr_ssmi_ancillary/monthly_means.html. Accessed 27 June 2008. Compiled from: Cavalieri, D., C. Parkinson, P. Gloersen, and H. J. Zwally. 1996. Sea ice concentrations from Nimbus-7 SMMR and DMSP SSM/I passive microwave data. Boulder, Colorado USA: National Snow and Ice Data Center. Digital media. Available at http://nsidc.org/data/nsidc-0051.html. Background: Monthly climatologies of sea ice concentration represent mean ice concentration percentages for each month over the entire time period 1979-2007, which is generated from passive microwave brightness temperature data derived from Nimbus-7 Scanning Multichannel Microwave Radiometer (SMMR) and Defense Meteorological Satellite Program (DMSP) -F8, -F11 and -F13 Special Sensor Microwave/Imager (SSM/I) radiances at a grid cell size of 25 x 25 km using the NASA Team algorithm developed by the Oceans and Ice Branch, Laboratory for Hydrospheric Processes at NASA Goddard Space Flight Center (GSFC). A threshold of 15 percent concentration has been applied to the monthly climatologies.
sea ice concentration, August (1979-2007) (sea_ice_concentration_08)
Stroeve, J. and W. Meier. 1999, updated 2008. Sea Ice Trends and Climatologies from SMMR and SSM/I. Boulder, Colorado USA: National Snow and Ice Data Center. Digital media. Available at http://nsidc.org/data/smmr_ssmi_ancillary/monthly_means.html. Accessed 27 June 2008. Compiled from: Cavalieri, D., C. Parkinson, P. Gloersen, and H. J. Zwally. 1996. Sea ice concentrations from Nimbus-7 SMMR and DMSP SSM/I passive microwave data. Boulder, Colorado USA: National Snow and Ice Data Center. Digital media. Available at http://nsidc.org/data/nsidc-0051.html. Background: Monthly climatologies of sea ice concentration represent mean ice concentration percentages for each month over the entire time period 1979-2007, which is generated from passive microwave brightness temperature data derived from Nimbus-7 Scanning Multichannel Microwave Radiometer (SMMR) and Defense Meteorological Satellite Program (DMSP) -F8, -F11 and -F13 Special Sensor Microwave/Imager (SSM/I) radiances at a grid cell size of 25 x 25 km using the NASA Team algorithm developed by the Oceans and Ice Branch, Laboratory for Hydrospheric Processes at NASA Goddard Space Flight Center (GSFC). A threshold of 15 percent concentration has been applied to the monthly climatologies.
sea ice concentration, September (1979-2007) (sea_ice_concentration_09)
Stroeve, J. and W. Meier. 1999, updated 2008. Sea Ice Trends and Climatologies from SMMR and SSM/I. Boulder, Colorado USA: National Snow and Ice Data Center. Digital media. Available at http://nsidc.org/data/smmr_ssmi_ancillary/monthly_means.html. Accessed 27 June 2008. Compiled from: Cavalieri, D., C. Parkinson, P. Gloersen, and H. J. Zwally. 1996. Sea ice concentrations from Nimbus-7 SMMR and DMSP SSM/I passive microwave data. Boulder, Colorado USA: National Snow and Ice Data Center. Digital media. Available at http://nsidc.org/data/nsidc-0051.html. Background: Monthly climatologies of sea ice concentration represent mean ice concentration percentages for each month over the entire time period 1979-2007, which is generated from passive microwave brightness temperature data derived from Nimbus-7 Scanning Multichannel Microwave Radiometer (SMMR) and Defense Meteorological Satellite Program (DMSP) -F8, -F11 and -F13 Special Sensor Microwave/Imager (SSM/I) radiances at a grid cell size of 25 x 25 km using the NASA Team algorithm developed by the Oceans and Ice Branch, Laboratory for Hydrospheric Processes at NASA Goddard Space Flight Center (GSFC). A threshold of 15 percent concentration has been applied to the monthly climatologies.
sea ice concentration, October (1979-2007) (sea_ice_concentration_10)
Stroeve, J. and W. Meier. 1999, updated 2008. Sea Ice Trends and Climatologies from SMMR and SSM/I. Boulder, Colorado USA: National Snow and Ice Data Center. Digital media. Available at http://nsidc.org/data/smmr_ssmi_ancillary/monthly_means.html. Accessed 27 June 2008. Compiled from: Cavalieri, D., C. Parkinson, P. Gloersen, and H. J. Zwally. 1996. Sea ice concentrations from Nimbus-7 SMMR and DMSP SSM/I passive microwave data. Boulder, Colorado USA: National Snow and Ice Data Center. Digital media. Available at http://nsidc.org/data/nsidc-0051.html. Background: Monthly climatologies of sea ice concentration represent mean ice concentration percentages for each month over the entire time period 1979-2007, which is generated from passive microwave brightness temperature data derived from Nimbus-7 Scanning Multichannel Microwave Radiometer (SMMR) and Defense Meteorological Satellite Program (DMSP) -F8, -F11 and -F13 Special Sensor Microwave/Imager (SSM/I) radiances at a grid cell size of 25 x 25 km using the NASA Team algorithm developed by the Oceans and Ice Branch, Laboratory for Hydrospheric Processes at NASA Goddard Space Flight Center (GSFC). A threshold of 15 percent concentration has been applied to the monthly climatologies.
sea ice concentration, November (1979-2007) (sea_ice_concentration_11)
Stroeve, J. and W. Meier. 1999, updated 2008. Sea Ice Trends and Climatologies from SMMR and SSM/I. Boulder, Colorado USA: National Snow and Ice Data Center. Digital media. Available at http://nsidc.org/data/smmr_ssmi_ancillary/monthly_means.html. Accessed 27 June 2008. Compiled from: Cavalieri, D., C. Parkinson, P. Gloersen, and H. J. Zwally. 1996. Sea ice concentrations from Nimbus-7 SMMR and DMSP SSM/I passive microwave data. Boulder, Colorado USA: National Snow and Ice Data Center. Digital media. Available at http://nsidc.org/data/nsidc-0051.html. Background: Monthly climatologies of sea ice concentration represent mean ice concentration percentages for each month over the entire time period 1979-2007, which is generated from passive microwave brightness temperature data derived from Nimbus-7 Scanning Multichannel Microwave Radiometer (SMMR) and Defense Meteorological Satellite Program (DMSP) -F8, -F11 and -F13 Special Sensor Microwave/Imager (SSM/I) radiances at a grid cell size of 25 x 25 km using the NASA Team algorithm developed by the Oceans and Ice Branch, Laboratory for Hydrospheric Processes at NASA Goddard Space Flight Center (GSFC). A threshold of 15 percent concentration has been applied to the monthly climatologies.
sea ice concentration, December (1979-2007) (sea_ice_concentration_12)
Stroeve, J. and W. Meier. 1999, updated 2008. Sea Ice Trends and Climatologies from SMMR and SSM/I. Boulder, Colorado USA: National Snow and Ice Data Center. Digital media. Available at http://nsidc.org/data/smmr_ssmi_ancillary/monthly_means.html. Accessed 27 June 2008. Compiled from: Cavalieri, D., C. Parkinson, P. Gloersen, and H. J. Zwally. 1996. Sea ice concentrations from Nimbus-7 SMMR and DMSP SSM/I passive microwave data. Boulder, Colorado USA: National Snow and Ice Data Center. Digital media. Available at http://nsidc.org/data/nsidc-0051.html. Background: Monthly climatologies of sea ice concentration represent mean ice concentration percentages for each month over the entire time period 1979-2007, which is generated from passive microwave brightness temperature data derived from Nimbus-7 Scanning Multichannel Microwave Radiometer (SMMR) and Defense Meteorological Satellite Program (DMSP) -F8, -F11 and -F13 Special Sensor Microwave/Imager (SSM/I) radiances at a grid cell size of 25 x 25 km using the NASA Team algorithm developed by the Oceans and Ice Branch, Laboratory for Hydrospheric Processes at NASA Goddard Space Flight Center (GSFC). A threshold of 15 percent concentration has been applied to the monthly climatologies.
land (land)
Four separate layers are used to map land in the Southern Hemisphere: (1.) the Gridded Population of the World Version 3 (GPWv3) for everything but Antarctica; and NSIDC's MODIS Mosaic of Antarctica (MOA)-based polygons for Antarctica's (2.) islands, (3.) grounding line or continent (excludes the ice shelves), and (4.) coastline (includes the ice shelves and is given a different color than the previous three layers). These sources are documented and cited in their respective layers below.
Antarctic ice shelves (antarctic_ice_shelves_fill)
Bohlander, J. and T. Scambos. 2007. Antarctic coastlines and grounding line derived from MODIS Mosaic of Antarctica (MOA). Boulder, Colorado USA: National Snow and Ice Data Center. Digital media. Accessed 24 April 2008. Background: These outlines were hand-digitized from the Moderate-resolution Imaging Spectroradiometer (MODIS) mosaic of Antarctica (MOA) image map produced and distributed by the National Snow and Ice Data Center (NSIDC) at: http://nsidc.org/data/nsidc-0280.html. The coastline includes the ice shelves surrounding Antarctica while the grounding line excludes them. Coastlines for islands surrounding Antarctica are provided separately from the rest of Antarctica's grounding line.
Antarctic continent (antarctic_continent)
Bohlander, J. and T. Scambos. 2007. Antarctic coastlines and grounding line derived from MODIS Mosaic of Antarctica (MOA). Boulder, Colorado USA: National Snow and Ice Data Center. Digital media. Accessed 24 April 2008. Background: These outlines were hand-digitized from the Moderate-resolution Imaging Spectroradiometer (MODIS) mosaic of Antarctica (MOA) image map produced and distributed by the National Snow and Ice Data Center (NSIDC) at: http://nsidc.org/data/nsidc-0280.html. The coastline includes the ice shelves surrounding Antarctica while the grounding line excludes them. Coastlines for islands surrounding Antarctica are provided separately from the rest of Antarctica's grounding line.
Antarctic islands (antarctic_islands)
Bohlander, J. and T. Scambos. 2007. Antarctic coastlines and grounding line derived from MODIS Mosaic of Antarctica (MOA). Boulder, Colorado USA: National Snow and Ice Data Center. Digital media. Accessed 24 April 2008. Background: These outlines were hand-digitized from the Moderate-resolution Imaging Spectroradiometer (MODIS) mosaic of Antarctica (MOA) image map produced and distributed by the National Snow and Ice Data Center (NSIDC) at: http://nsidc.org/data/nsidc-0280.html. The coastline includes the ice shelves surrounding Antarctica while the grounding line excludes them. Coastlines for islands surrounding Antarctica are provided separately from the rest of Antarctica's grounding line.
land (excluding Antarctica) (land_excluding_antarctica)
Center for International Earth Science Information Network (CIESIN), Columbia University; and Centro Internacional de Agricultura Tropical (CIAT). 2005. Gridded Population of the World Version 3 (GPWv3): Coastlines. Palisades, NY, USA: Socioeconomic Data and Applications Center (SEDAC), Columbia University. Available at http://sedac.ciesin.columbia.edu/gpw. 19 January 2007. Background: Coastlines derived from the Gridded Population of the World (GPW) land area grid at 2.5 arc-minute resolution. Permanent ice and all but large lakes have been merged with neighbouring polygons to make a layer more appropriate for cartographic visualization of the data. Does not include Antarctica.
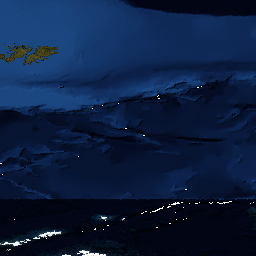
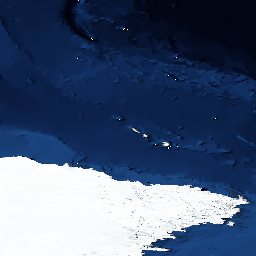
Antarctic satellite image (antarctica_satellite_image)
Haran, T., J. Bohlander, T. Scambos, T. Painter, and M. Fahnestock compilers. 2005, updated 2006. MODIS mosaic of Antarctica (MOA) image map. Boulder, CO, USA: National Snow and Ice Data Center. Digital media. Available at http://nsidc.org/data/nsidc-0280.html. Background: The MODIS Mosaic of Antarctica (MOA) surface morphology image map is derived from composites of 260 MODIS (Moderate-resolution Imaging Spectroradiometer) orbit swaths acquired between 20 November 2003 and 29 February 2004. The MOA provides a cloud-free view of the ice sheet, ice shelves, and land surfaces. All land areas larger than a few hundred meters that are south of 60 deg S are included in the mosaic, as well as persistent fast ice regions and some grounded icebergs present near the coast in the 2003-2004 austral summer. The MOA surface morphology image map is derived from digitally processed MODIS Band 1 data: this is viewable in the Atlas of the Cryosphere at a grid scale of 125 m.
seasonal snow classification (seasonal_snow_classification)
The seasonal snow classification data set (Liston and Sturm, 1998) labels all of Antarctica as an 'ice' class. The MODIS Mosaic of Antarctica (MOA)-based grounding line of Antarctica is used in place of this data set's Antarctic coastline, however, in order for the coastlines to be consistent throughout the Atlas. These sources are documented and cited in their respective layers below.
seasonal snow classification (excluding Antarctica) (seasonal_snow_classification_excluding_antarctica)
Liston, G.E., and M. Sturm. 1998. Global seasonal snow classification system. Boulder, CO, USA: National Snow and Ice Data Center. Digital media. Available at http://nsidc.org/data/arcss045.html. 31 August 2006. Background: Based on the physical properties of the snow (depth, density, thermal conductivity, number of layers, degree of wetting, etc.), the world's seasonal snow covers are divided into six classes, plus classes for water and ice fields. Each class is defined by its physical properties, then empirically related to climate using three variables (precipitation, wind, and air temperature). A vegetation proxy was used for wind data: tall vegetation equals low wind, short vegetation equals high wind.
Antarctic continent (seasonal_snow_classification_antarctica)
Bohlander, J. and T. Scambos. 2007. Antarctic coastlines and grounding line derived from MODIS Mosaic of Antarctica (MOA). Boulder, Colorado USA: National Snow and Ice Data Center. Digital media. Accessed 24 April 2008. Background: These outlines were hand-digitized from the Moderate-resolution Imaging Spectroradiometer (MODIS) mosaic of Antarctica (MOA) image map produced and distributed by the National Snow and Ice Data Center (NSIDC) at: http://nsidc.org/data/nsidc-0280.html. The coastline includes the ice shelves surrounding Antarctica while the grounding line excludes them. Coastlines for islands surrounding Antarctica are provided separately from the rest of Antarctica's grounding line.
Antarctic islands (seasonal_snow_classification_antarctica_islands)
Bohlander, J. and T. Scambos. 2007. Antarctic coastlines and grounding line derived from MODIS Mosaic of Antarctica (MOA). Boulder, Colorado USA: National Snow and Ice Data Center. Digital media. Accessed 24 April 2008. Background: These outlines were hand-digitized from the Moderate-resolution Imaging Spectroradiometer (MODIS) mosaic of Antarctica (MOA) image map produced and distributed by the National Snow and Ice Data Center (NSIDC) at: http://nsidc.org/data/nsidc-0280.html. The coastline includes the ice shelves surrounding Antarctica while the grounding line excludes them. Coastlines for islands surrounding Antarctica are provided separately from the rest of Antarctica's grounding line.
snow extent, January (1988-2003) (snow_extent_01)
The snow extent data set (Armstrong et al., 2005) labels all of Antarctica as covered by snow. The MODIS Mosaic of Antarctica (MOA)-based grounding line of Antarctica is used in place of this data set's Antarctic coastline, however, in order for the coastlines to be consistent throughout the Atlas. These sources are documented and cited in their respective layers below.
snow extent, January (1988-2003) (excluding Antarctica) (snow_extent_01_excluding_antarctica)
Armstrong, R.L., M.J. Brodzik, K. Knowles, and M. Savoie. 2005. Global monthly EASE-Grid snow water equivalent climatology. Boulder, CO, USA: National Snow and Ice Data Center. Digital media. Available at http://nsidc.org/data/nsidc-0271.html. 30 August 2006. Background: Snow extent includes the continent of Antarctica and all areas where snow water equivalent (SWE) is greater than 0 mm. Global, monthly SWE climatologies are generated from passive microwave brightness temperature data derived from Nimbus-7 Scanning Multichannel Microwave Radiometer (SMMR) and Defense Meteorological Satellite Program (DMSP) -F8, -F11 and -F13 Special Sensor Microwave/Imager (SSM/I) radiances and gridded to the Northern and Southern 25 km Equal-Area Scalable Earth Grids (EASE-Grids).
Antarctic continent (snow_extent_01_antarctica)
Bohlander, J. and T. Scambos. 2007. Antarctic coastlines and grounding line derived from MODIS Mosaic of Antarctica (MOA). Boulder, Colorado USA: National Snow and Ice Data Center. Digital media. Accessed 24 April 2008. Background: These outlines were hand-digitized from the Moderate-resolution Imaging Spectroradiometer (MODIS) mosaic of Antarctica (MOA) image map produced and distributed by the National Snow and Ice Data Center (NSIDC) at: http://nsidc.org/data/nsidc-0280.html. The coastline includes the ice shelves surrounding Antarctica while the grounding line excludes them. Coastlines for islands surrounding Antarctica are provided separately from the rest of Antarctica's grounding line.
Antarctic islands (snow_extent_01_antarctica_islands)
Bohlander, J. and T. Scambos. 2007. Antarctic coastlines and grounding line derived from MODIS Mosaic of Antarctica (MOA). Boulder, Colorado USA: National Snow and Ice Data Center. Digital media. Accessed 24 April 2008. Background: These outlines were hand-digitized from the Moderate-resolution Imaging Spectroradiometer (MODIS) mosaic of Antarctica (MOA) image map produced and distributed by the National Snow and Ice Data Center (NSIDC) at: http://nsidc.org/data/nsidc-0280.html. The coastline includes the ice shelves surrounding Antarctica while the grounding line excludes them. Coastlines for islands surrounding Antarctica are provided separately from the rest of Antarctica's grounding line.
snow extent, February (1988-2003) (snow_extent_02)
The snow extent data set (Armstrong et al., 2005) labels all of Antarctica as covered by snow. The MODIS Mosaic of Antarctica (MOA)-based grounding line of Antarctica is used in place of this data set's Antarctic coastline, however, in order for the coastlines to be consistent throughout the Atlas. These sources are docume nted and cited in their respective layers below.
snow extent, February (1988-2003) (excluding Antarctica) (snow_extent_02_excluding_antarctica)
Armstrong, R.L., M.J. Brodzik, K. Knowles, and M. Savoie. 2005. Global monthly EASE-Grid snow water equivalent climatology. Boulder, CO, USA: National Snow and Ice Data Center. Digital media. Available at http://nsidc.org/data/nsidc-0271.html. 30 August 2006. Background: Snow extent includes the continent of Antarctica and all areas where snow water equivalent (SWE) is greater than 0 mm. Global, monthly SWE climatologies are generated from passive microwave brightness temperature data derived from Nimbus-7 Scanning Multichannel Microwave Radiometer (SMMR) and Defense Meteorological Satellite Program (DMSP) -F8, -F11 and -F13 Special Sensor Microwave/Imager (SSM/I) radiances and gridded to the Northern and Southern 25 km Equal-Area Scalable Earth Grids (EASE-Grids).
Antarctic continent (snow_extent_02_antarctica)
Bohlander, J. and T. Scambos. 2007. Antarctic coastlines and grounding line derived from MODIS Mosaic of Antarctica (MOA). Boulder, Colorado USA: National Snow and Ice Data Center. Digital media. Accessed 24 April 2008. Background: These outlines were hand-digitized from the Moderate-resolution Imaging Spectroradiometer (MODIS) mosaic of Antarctica (MOA) image map produced and distributed by the National Snow and Ice Data Center (NSIDC) at: http://nsidc.org/data/nsidc-0280.html. The coastline includes the ice shelves surrounding Antarctica while the grounding line excludes them. Coastlines for islands surrounding Antarctica are provided separately from the rest of Antarctica's grounding line.
Antarctic islands (snow_extent_02_antarctica_islands)
Bohlander, J. and T. Scambos. 2007. Antarctic coastlines and grounding line derived from MODIS Mosaic of Antarctica (MOA). Boulder, Colorado USA: National Snow and Ice Data Center. Digital media. Accessed 24 April 2008. Background: These outlines were hand-digitized from the Moderate-resolution Imaging Spectroradiometer (MODIS) mosaic of Antarctica (MOA) image map produced and distributed by the National Snow and Ice Data Center (NSIDC) at: http://nsidc.org/data/nsidc-0280.html. The coastline includes the ice shelves surrounding Antarctica while the grounding line excludes them. Coastlines for islands surrounding Antarctica are provided separately from the rest of Antarctica's grounding line.
snow extent, March (1988-2003) (snow_extent_03)
The snow extent data set (Armstrong et al., 2005) labels all of Antarctica as covered by snow. The MODIS Mosaic of Antarctica (MOA)-based grounding line of Antarctica is used in place of this data set's Antarctic coastline, however, in order for the coastlines to be consistent throughout the Atlas. These sources are docume nted and cited in their respective layers below.
snow extent, March (1988-2003) (excluding Antarctica) (snow_extent_03_excluding_antarctica)
Armstrong, R.L., M.J. Brodzik, K. Knowles, and M. Savoie. 2005. Global monthly EASE-Grid snow water equivalent climatology. Boulder, CO, USA: National Snow and Ice Data Center. Digital media. Available at http://nsidc.org/data/nsidc-0271.html. 30 August 2006. Background: Snow extent includes the continent of Antarctica and all areas where snow water equivalent (SWE) is greater than 0 mm. Global, monthly SWE climatologies are generated from passive microwave brightness temperature data derived from Nimbus-7 Scanning Multichannel Microwave Radiometer (SMMR) and Defense Meteorological Satellite Program (DMSP) -F8, -F11 and -F13 Special Sensor Microwave/Imager (SSM/I) radiances and gridded to the Northern and Southern 25 km Equal-Area Scalable Earth Grids (EASE-Grids).
Antarctic continent (snow_extent_03_antarctica)
Bohlander, J. and T. Scambos. 2007. Antarctic coastlines and grounding line derived from MODIS Mosaic of Antarctica (MOA). Boulder, Colorado USA: National Snow and Ice Data Center. Digital media. Accessed 24 April 2008. Background: These outlines were hand-digitized from the Moderate-resolution Imaging Spectroradiometer (MODIS) mosaic of Antarctica (MOA) image map produced and distributed by the National Snow and Ice Data Center (NSIDC) at: http://nsidc.org/data/nsidc-0280.html. The coastline includes the ice shelves surrounding Antarctica while the grounding line excludes them. Coastlines for islands surrounding Antarctica are provided separately from the rest of Antarctica's grounding line.
Antarctic islands (snow_extent_03_antarctica_islands)
Bohlander, J. and T. Scambos. 2007. Antarctic coastlines and grounding line derived from MODIS Mosaic of Antarctica (MOA). Boulder, Colorado USA: National Snow and Ice Data Center. Digital media. Accessed 24 April 2008. Background: These outlines were hand-digitized from the Moderate-resolution Imaging Spectroradiometer (MODIS) mosaic of Antarctica (MOA) image map produced and distributed by the National Snow and Ice Data Center (NSIDC) at: http://nsidc.org/data/nsidc-0280.html. The coastline includes the ice shelves surrounding Antarctica while the grounding line excludes them. Coastlines for islands surrounding Antarctica are provided separately from the rest of Antarctica's grounding line.
snow extent, April (1988-2003) (snow_extent_04)
The snow extent data set (Armstrong et al., 2005) labels all of Antarctica as covered by snow. The MODIS Mosaic of Antarctica (MOA)-based grounding line of Antarctica is used in place of this data set's Antarctic coastline, however, in order for the coastlines to be consistent throughout the Atlas. These sources are docume nted and cited in their respective layers below.
snow extent, April (1988-2003) (excluding Antarctica) (snow_extent_04_excluding_antarctica)
Armstrong, R.L., M.J. Brodzik, K. Knowles, and M. Savoie. 2005. Global monthly EASE-Grid snow water equivalent climatology. Boulder, CO, USA: National Snow and Ice Data Center. Digital media. Available at http://nsidc.org/data/nsidc-0271.html. 30 August 2006. Background: Snow extent includes the continent of Antarctica and all areas where snow water equivalent (SWE) is greater than 0 mm. Global, monthly SWE climatologies are generated from passive microwave brightness temperature data derived from Nimbus-7 Scanning Multichannel Microwave Radiometer (SMMR) and Defense Meteorological Satellite Program (DMSP) -F8, -F11 and -F13 Special Sensor Microwave/Imager (SSM/I) radiances and gridded to the Northern and Southern 25 km Equal-Area Scalable Earth Grids (EASE-Grids).
Antarctic continent (snow_extent_04_antarctica)
Bohlander, J. and T. Scambos. 2007. Antarctic coastlines and grounding line derived from MODIS Mosaic of Antarctica (MOA). Boulder, Colorado USA: National Snow and Ice Data Center. Digital media. Accessed 24 April 2008. Background: These outlines were hand-digitized from the Moderate-resolution Imaging Spectroradiometer (MODIS) mosaic of Antarctica (MOA) image map produced and distributed by the National Snow and Ice Data Center (NSIDC) at: http://nsidc.org/data/nsidc-0280.html. The coastline includes the ice shelves surrounding Antarctica while the grounding line excludes them. Coastlines for islands surrounding Antarctica are provided separately from the rest of Antarctica's grounding line.
Antarctic islands (snow_extent_04_antarctica_islands)
Bohlander, J. and T. Scambos. 2007. Antarctic coastlines and grounding line derived from MODIS Mosaic of Antarctica (MOA). Boulder, Colorado USA: National Snow and Ice Data Center. Digital media. Accessed 24 April 2008. Background: These outlines were hand-digitized from the Moderate-resolution Imaging Spectroradiometer (MODIS) mosaic of Antarctica (MOA) image map produced and distributed by the National Snow and Ice Data Center (NSIDC) at: http://nsidc.org/data/nsidc-0280.html. The coastline includes the ice shelves surrounding Antarctica while the grounding line excludes them. Coastlines for islands surrounding Antarctica are provided separately from the rest of Antarctica's grounding line.
snow extent, May (1988-2003) (snow_extent_05)
The snow extent data set (Armstrong et al., 2005) labels all of Antarctica as covered by snow. The MODIS Mosaic of Antarctica (MOA)-based grounding line of Antarctica is used in place of this data set's Antarctic coastline, however, in order for the coastlines to be consistent throughout the Atlas. These sources are docume nted and cited in their respective layers below.
snow extent, May (1988-2003) (excluding Antarctica) (snow_extent_05_excluding_antarctica)
Armstrong, R.L., M.J. Brodzik, K. Knowles, and M. Savoie. 2005. Global monthly EASE-Grid snow water equivalent climatology. Boulder, CO, USA: National Snow and Ice Data Center. Digital media. Available at http://nsidc.org/data/nsidc-0271.html. 30 August 2006. Background: Snow extent includes the continent of Antarctica and all areas where snow water equivalent (SWE) is greater than 0 mm. Global, monthly SWE climatologies are generated from passive microwave brightness temperature data derived from Nimbus-7 Scanning Multichannel Microwave Radiometer (SMMR) and Defense Meteorological Satellite Program (DMSP) -F8, -F11 and -F13 Special Sensor Microwave/Imager (SSM/I) radiances and gridded to the Northern and Southern 25 km Equal-Area Scalable Earth Grids (EASE-Grids).
Antarctic continent (snow_extent_05_antarctica)
Bohlander, J. and T. Scambos. 2007. Antarctic coastlines and grounding line derived from MODIS Mosaic of Antarctica (MOA). Boulder, Colorado USA: National Snow and Ice Data Center. Digital media. Accessed 24 April 2008. Background: These outlines were hand-digitized from the Moderate-resolution Imaging Spectroradiometer (MODIS) mosaic of Antarctica (MOA) image map produced and distributed by the National Snow and Ice Data Center (NSIDC) at: http://nsidc.org/data/nsidc-0280.html. The coastline includes the ice shelves surrounding Antarctica while the grounding line excludes them. Coastlines for islands surrounding Antarctica are provided separately from the rest of Antarctica's grounding line.
Antarctic islands (snow_extent_05_antarctica_islands)
Bohlander, J. and T. Scambos. 2007. Antarctic coastlines and grounding line derived from MODIS Mosaic of Antarctica (MOA). Boulder, Colorado USA: National Snow and Ice Data Center. Digital media. Accessed 24 April 2008. Background: These outlines were hand-digitized from the Moderate-resolution Imaging Spectroradiometer (MODIS) mosaic of Antarctica (MOA) image map produced and distributed by the National Snow and Ice Data Center (NSIDC) at: http://nsidc.org/data/nsidc-0280.html. The coastline includes the ice shelves surrounding Antarctica while the grounding line excludes them. Coastlines for islands surrounding Antarctica are provided separately from the rest of Antarctica's grounding line.
snow extent, June (1988-2003) (snow_extent_06)
The snow extent data set (Armstrong et al., 2005) labels all of Antarctica as covered by snow. The MODIS Mosaic of Antarctica (MOA)-based grounding line of Antarctica is used in place of this data set's Antarctic coastline, however, in order for the coastlines to be consistent throughout the Atlas. These sources are docume nted and cited in their respective layers below.
snow extent, June (1988-2003) (excluding Antarctica) (snow_extent_06_excluding_antarctica)
Armstrong, R.L., M.J. Brodzik, K. Knowles, and M. Savoie. 2005. Global monthly EASE-Grid snow water equivalent climatology. Boulder, CO, USA: National Snow and Ice Data Center. Digital media. Available at http://nsidc.org/data/nsidc-0271.html. 30 August 2006. Background: Snow extent includes the continent of Antarctica and all areas where snow water equivalent (SWE) is greater than 0 mm. Global, monthly SWE climatologies are generated from passive microwave brightness temperature data derived from Nimbus-7 Scanning Multichannel Microwave Radiometer (SMMR) and Defense Meteorological Satellite Program (DMSP) -F8, -F11 and -F13 Special Sensor Microwave/Imager (SSM/I) radiances and gridded to the Northern and Southern 25 km Equal-Area Scalable Earth Grids (EASE-Grids).
Antarctic continent (snow_extent_06_antarctica)
Bohlander, J. and T. Scambos. 2007. Antarctic coastlines and grounding line derived from MODIS Mosaic of Antarctica (MOA). Boulder, Colorado USA: National Snow and Ice Data Center. Digital media. Accessed 24 April 2008. Background: These outlines were hand-digitized from the Moderate-resolution Imaging Spectroradiometer (MODIS) mosaic of Antarctica (MOA) image map produced and distributed by the National Snow and Ice Data Center (NSIDC) at: http://nsidc.org/data/nsidc-0280.html. The coastline includes the ice shelves surrounding Antarctica while the grounding line excludes them. Coastlines for islands surrounding Antarctica are provided separately from the rest of Antarctica's grounding line.
Antarctic islands (snow_extent_06_antarctica_islands)
Bohlander, J. and T. Scambos. 2007. Antarctic coastlines and grounding line derived from MODIS Mosaic of Antarctica (MOA). Boulder, Colorado USA: National Snow and Ice Data Center. Digital media. Accessed 24 April 2008. Background: These outlines were hand-digitized from the Moderate-resolution Imaging Spectroradiometer (MODIS) mosaic of Antarctica (MOA) image map produced and distributed by the National Snow and Ice Data Center (NSIDC) at: http://nsidc.org/data/nsidc-0280.html. The coastline includes the ice shelves surrounding Antarctica while the grounding line excludes them. Coastlines for islands surrounding Antarctica are provided separately from the rest of Antarctica's grounding line.
snow extent, July (1988-2002) (snow_extent_07)
The snow extent data set (Armstrong et al., 2005) labels all of Antarctica as covered by snow. The MODIS Mosaic of Antarctica (MOA)-based grounding line of Antarctica is used in place of this data set's Antarctic coastline, however, in order for the coastlines to be consistent throughout the Atlas. These sources are docume nted and cited in their respective layers below.
snow extent, July (1988-2002) (excluding Antarctica) (snow_extent_07_excluding_antarctica)
Armstrong, R.L., M.J. Brodzik, K. Knowles, and M. Savoie. 2005. Global monthly EASE-Grid snow water equivalent climatology. Boulder, CO, USA: National Snow and Ice Data Center. Digital media. Available at http://nsidc.org/data/nsidc-0271.html. 30 August 2006. Background: Snow extent includes the continent of Antarctica and all areas where snow water equivalent (SWE) is greater than 0 mm. Global, monthly SWE climatologies are generated from passive microwave brightness temperature data derived from Nimbus-7 Scanning Multichannel Microwave Radiometer (SMMR) and Defense Meteorological Satellite Program (DMSP) -F8, -F11 and -F13 Special Sensor Microwave/Imager (SSM/I) radiances and gridded to the Northern and Southern 25 km Equal-Area Scalable Earth Grids (EASE-Grids).
Antarctic continent (snow_extent_07_antarctica)
Bohlander, J. and T. Scambos. 2007. Antarctic coastlines and grounding line derived from MODIS Mosaic of Antarctica (MOA). Boulder, Colorado USA: National Snow and Ice Data Center. Digital media. Accessed 24 April 2008. Background: These outlines were hand-digitized from the Moderate-resolution Imaging Spectroradiometer (MODIS) mosaic of Antarctica (MOA) image map produced and distributed by the National Snow and Ice Data Center (NSIDC) at: http://nsidc.org/data/nsidc-0280.html. The coastline includes the ice shelves surrounding Antarctica while the grounding line excludes them. Coastlines for islands surrounding Antarctica are provided separately from the rest of Antarctica's grounding line.
Antarctic islands (snow_extent_07_antarctica_islands)
Bohlander, J. and T. Scambos. 2007. Antarctic coastlines and grounding line derived from MODIS Mosaic of Antarctica (MOA). Boulder, Colorado USA: National Snow and Ice Data Center. Digital media. Accessed 24 April 2008. Background: These outlines were hand-digitized from the Moderate-resolution Imaging Spectroradiometer (MODIS) mosaic of Antarctica (MOA) image map produced and distributed by the National Snow and Ice Data Center (NSIDC) at: http://nsidc.org/data/nsidc-0280.html. The coastline includes the ice shelves surrounding Antarctica while the grounding line excludes them. Coastlines for islands surrounding Antarctica are provided separately from the rest of Antarctica's grounding line.
snow extent, August (1987-2002) (snow_extent_08)
The snow extent data set (Armstrong et al., 2005) labels all of Antarctica as covered by snow. The MODIS Mosaic of Antarctica (MOA)-based grounding line of Antarctica is used in place of this data set's Antarctic coastline, however, in order for the coastlines to be consistent throughout the Atlas. These sources are docume nted and cited in their respective layers below.
snow extent, August (1987-2002) (excluding Antarctica) (snow_extent_08_excluding_antarctica)
Armstrong, R.L., M.J. Brodzik, K. Knowles, and M. Savoie. 2005. Global monthly EASE-Grid snow water equivalent climatology. Boulder, CO, USA: National Snow and Ice Data Center. Digital media. Available at http://nsidc.org/data/nsidc-0271.html. 30 August 2006. Background: Snow extent includes the continent of Antarctica and all areas where snow water equivalent (SWE) is greater than 0 mm. Global, monthly SWE climatologies are generated from passive microwave brightness temperature data derived from Nimbus-7 Scanning Multichannel Microwave Radiometer (SMMR) and Defense Meteorological Satellite Program (DMSP) -F8, -F11 and -F13 Special Sensor Microwave/Imager (SSM/I) radiances and gridded to the Northern and Southern 25 km Equal-Area Scalable Earth Grids (EASE-Grids).
Antarctic continent (snow_extent_08_antarctica)
Bohlander, J. and T. Scambos. 2007. Antarctic coastlines and grounding line derived from MODIS Mosaic of Antarctica (MOA). Boulder, Colorado USA: National Snow and Ice Data Center. Digital media. Accessed 24 April 2008. Background: These outlines were hand-digitized from the Moderate-resolution Imaging Spectroradiometer (MODIS) mosaic of Antarctica (MOA) image map produced and distributed by the National Snow and Ice Data Center (NSIDC) at: http://nsidc.org/data/nsidc-0280.html. The coastline includes the ice shelves surrounding Antarctica while the grounding line excludes them. Coastlines for islands surrounding Antarctica are provided separately from the rest of Antarctica's grounding line.
Antarctic islands (snow_extent_08_antarctica_islands)
Bohlander, J. and T. Scambos. 2007. Antarctic coastlines and grounding line derived from MODIS Mosaic of Antarctica (MOA). Boulder, Colorado USA: National Snow and Ice Data Center. Digital media. Accessed 24 April 2008. Background: These outlines were hand-digitized from the Moderate-resolution Imaging Spectroradiometer (MODIS) mosaic of Antarctica (MOA) image map produced and distributed by the National Snow and Ice Data Center (NSIDC) at: http://nsidc.org/data/nsidc-0280.html. The coastline includes the ice shelves surrounding Antarctica while the grounding line excludes them. Coastlines for islands surrounding Antarctica are provided separately from the rest of Antarctica's grounding line.
snow extent, September (1987-2002) (snow_extent_09)
The snow extent data set (Armstrong et al., 2005) labels all of Antarctica as covered by snow. The MODIS Mosaic of Antarctica (MOA)-based grounding line of Antarctica is used in place of this data set's Antarctic coastline, however, in order for the coastlines to be consistent throughout the Atlas. These sources are docume nted and cited in their respective layers below.
snow extent, September (1987-2002) (excluding Antarctica) (snow_extent_09_excluding_antarctica)
Armstrong, R.L., M.J. Brodzik, K. Knowles, and M. Savoie. 2005. Global monthly EASE-Grid snow water equivalent climatology. Boulder, CO, USA: National Snow and Ice Data Center. Digital media. Available at http://nsidc.org/data/nsidc-0271.html. 30 August 2006. Background: Snow extent includes the continent of Antarctica and all areas where snow water equivalent (SWE) is greater than 0 mm. Global, monthly SWE climatologies are generated from passive microwave brightness temperature data derived from Nimbus-7 Scanning Multichannel Microwave Radiometer (SMMR) and Defense Meteorological Satellite Program (DMSP) -F8, -F11 and -F13 Special Sensor Microwave/Imager (SSM/I) radiances and gridded to the Northern and Southern 25 km Equal-Area Scalable Earth Grids (EASE-Grids).
Antarctic continent (snow_extent_09_antarctica)
Bohlander, J. and T. Scambos. 2007. Antarctic coastlines and grounding line derived from MODIS Mosaic of Antarctica (MOA). Boulder, Colorado USA: National Snow and Ice Data Center. Digital media. Accessed 24 April 2008. Background: These outlines were hand-digitized from the Moderate-resolution Imaging Spectroradiometer (MODIS) mosaic of Antarctica (MOA) image map produced and distributed by the National Snow and Ice Data Center (NSIDC) at: http://nsidc.org/data/nsidc-0280.html. The coastline includes the ice shelves surrounding Antarctica while the grounding line excludes them. Coastlines for islands surrounding Antarctica are provided separately from the rest of Antarctica's grounding line.
Antarctic islands (snow_extent_09_antarctica_islands)
Bohlander, J. and T. Scambos. 2007. Antarctic coastlines and grounding line derived from MODIS Mosaic of Antarctica (MOA). Boulder, Colorado USA: National Snow and Ice Data Center. Digital media. Accessed 24 April 2008. Background: These outlines were hand-digitized from the Moderate-resolution Imaging Spectroradiometer (MODIS) mosaic of Antarctica (MOA) image map produced and distributed by the National Snow and Ice Data Center (NSIDC) at: http://nsidc.org/data/nsidc-0280.html. The coastline includes the ice shelves surrounding Antarctica while the grounding line excludes them. Coastlines for islands surrounding Antarctica are provided separately from the rest of Antarctica's grounding line.
snow extent, October (1987-2002) (snow_extent_10)
The snow extent data set (Armstrong et al., 2005) labels all of Antarctica as covered by snow. The MODIS Mosaic of Antarctica (MOA)-based grounding line of Antarctica is used in place of this data set's Antarctic coastline, however, in order for the coastlines to be consistent throughout the Atlas. These sources are docume nted and cited in their respective layers below.
snow extent, October (1987-2002) (excluding Antarctica) (snow_extent_10_excluding_antarctica)
Armstrong, R.L., M.J. Brodzik, K. Knowles, and M. Savoie. 2005. Global monthly EASE-Grid snow water equivalent climatology. Boulder, CO, USA: National Snow and Ice Data Center. Digital media. Available at http://nsidc.org/data/nsidc-0271.html. 30 August 2006. Background: Snow extent includes the continent of Antarctica and all areas where snow water equivalent (SWE) is greater than 0 mm. Global, monthly SWE climatologies are generated from passive microwave brightness temperature data derived from Nimbus-7 Scanning Multichannel Microwave Radiometer (SMMR) and Defense Meteorological Satellite Program (DMSP) -F8, -F11 and -F13 Special Sensor Microwave/Imager (SSM/I) radiances and gridded to the Northern and Southern 25 km Equal-Area Scalable Earth Grids (EASE-Grids).
Antarctic continent (snow_extent_10_antarctica)
Bohlander, J. and T. Scambos. 2007. Antarctic coastlines and grounding line derived from MODIS Mosaic of Antarctica (MOA). Boulder, Colorado USA: National Snow and Ice Data Center. Digital media. Accessed 24 April 2008. Background: These outlines were hand-digitized from the Moderate-resolution Imaging Spectroradiometer (MODIS) mosaic of Antarctica (MOA) image map produced and distributed by the National Snow and Ice Data Center (NSIDC) at: http://nsidc.org/data/nsidc-0280.html. The coastline includes the ice shelves surrounding Antarctica while the grounding line excludes them. Coastlines for islands surrounding Antarctica are provided separately from the rest of Antarctica's grounding line.
Antarctic islands (snow_extent_10_antarctica_islands)
Bohlander, J. and T. Scambos. 2007. Antarctic coastlines and grounding line derived from MODIS Mosaic of Antarctica (MOA). Boulder, Colorado USA: National Snow and Ice Data Center. Digital media. Accessed 24 April 2008. Background: These outlines were hand-digitized from the Moderate-resolution Imaging Spectroradiometer (MODIS) mosaic of Antarctica (MOA) image map produced and distributed by the National Snow and Ice Data Center (NSIDC) at: http://nsidc.org/data/nsidc-0280.html. The coastline includes the ice shelves surrounding Antarctica while the grounding line excludes them. Coastlines for islands surrounding Antarctica are provided separately from the rest of Antarctica's grounding line.
snow extent, November (1987-2002) (snow_extent_11)
The snow extent data set (Armstrong et al., 2005) labels all of Antarctica as covered by snow. The MODIS Mosaic of Antarctica (MOA)-based grounding line of Antarctica is used in place of this data set's Antarctic coastline, however, in order for the coastlines to be consistent throughout the Atlas. These sources are docume nted and cited in their respective layers below.
snow extent, November (1987-2002) (excluding Antarctica) (snow_extent_11_excluding_antarctica)
Armstrong, R.L., M.J. Brodzik, K. Knowles, and M. Savoie. 2005. Global monthly EASE-Grid snow water equivalent climatology. Boulder, CO, USA: National Snow and Ice Data Center. Digital media. Available at http://nsidc.org/data/nsidc-0271.html. 30 August 2006. Background: Snow extent includes the continent of Antarctica and all areas where snow water equivalent (SWE) is greater than 0 mm. Global, monthly SWE climatologies are generated from passive microwave brightness temperature data derived from Nimbus-7 Scanning Multichannel Microwave Radiometer (SMMR) and Defense Meteorological Satellite Program (DMSP) -F8, -F11 and -F13 Special Sensor Microwave/Imager (SSM/I) radiances and gridded to the Northern and Southern 25 km Equal-Area Scalable Earth Grids (EASE-Grids).
Antarctic continent (snow_extent_11_antarctica)
Bohlander, J. and T. Scambos. 2007. Antarctic coastlines and grounding line derived from MODIS Mosaic of Antarctica (MOA). Boulder, Colorado USA: National Snow and Ice Data Center. Digital media. Accessed 24 April 2008. Background: These outlines were hand-digitized from the Moderate-resolution Imaging Spectroradiometer (MODIS) mosaic of Antarctica (MOA) image map produced and distributed by the National Snow and Ice Data Center (NSIDC) at: http://nsidc.org/data/nsidc-0280.html. The coastline includes the ice shelves surrounding Antarctica while the grounding line excludes them. Coastlines for islands surrounding Antarctica are provided separately from the rest of Antarctica's grounding line.
Antarctic islands (snow_extent_11_antarctica_islands)
Bohlander, J. and T. Scambos. 2007. Antarctic coastlines and grounding line derived from MODIS Mosaic of Antarctica (MOA). Boulder, Colorado USA: National Snow and Ice Data Center. Digital media. Accessed 24 April 2008. Background: These outlines were hand-digitized from the Moderate-resolution Imaging Spectroradiometer (MODIS) mosaic of Antarctica (MOA) image map produced and distributed by the National Snow and Ice Data Center (NSIDC) at: http://nsidc.org/data/nsidc-0280.html. The coastline includes the ice shelves surrounding Antarctica while the grounding line excludes them. Coastlines for islands surrounding Antarctica are provided separately from the rest of Antarctica's grounding line.
snow extent, December (1987-2002) (snow_extent_12)
The snow extent data set (Armstrong et al., 2005) labels all of Antarctica as covered by snow. The MODIS Mosaic of Antarctica (MOA)-based grounding line of Antarctica is used in place of this data set's Antarctic coastline, however, in order for the coastlines to be consistent throughout the Atlas. These sources are docume nted and cited in their respective layers below.
snow extent, December (1987-2002) (excluding Antarctica) (snow_extent_12_excluding_antarctica)
Armstrong, R.L., M.J. Brodzik, K. Knowles, and M. Savoie. 2005. Global monthly EASE-Grid snow water equivalent climatology. Boulder, CO, USA: National Snow and Ice Data Center. Digital media. Available at http://nsidc.org/data/nsidc-0271.html. 30 August 2006. Background: Snow extent includes the continent of Antarctica and all areas where snow water equivalent (SWE) is greater than 0 mm. Global, monthly SWE climatologies are generated from passive microwave brightness temperature data derived from Nimbus-7 Scanning Multichannel Microwave Radiometer (SMMR) and Defense Meteorological Satellite Program (DMSP) -F8, -F11 and -F13 Special Sensor Microwave/Imager (SSM/I) radiances and gridded to the Northern and Southern 25 km Equal-Area Scalable Earth Grids (EASE-Grids).
Antarctic continent (snow_extent_12_antarctica)
Bohlander, J. and T. Scambos. 2007. Antarctic coastlines and grounding line derived from MODIS Mosaic of Antarctica (MOA). Boulder, Colorado USA: National Snow and Ice Data Center. Digital media. Accessed 24 April 2008. Background: These outlines were hand-digitized from the Moderate-resolution Imaging Spectroradiometer (MODIS) mosaic of Antarctica (MOA) image map produced and distributed by the National Snow and Ice Data Center (NSIDC) at: http://nsidc.org/data/nsidc-0280.html. The coastline includes the ice shelves surrounding Antarctica while the grounding line excludes them. Coastlines for islands surrounding Antarctica are provided separately from the rest of Antarctica's grounding line.
Antarctic islands (snow_extent_12_antarctica_islands)
Bohlander, J. and T. Scambos. 2007. Antarctic coastlines and grounding line derived from MODIS Mosaic of Antarctica (MOA). Boulder, Colorado USA: National Snow and Ice Data Center. Digital media. Accessed 24 April 2008. Background: These outlines were hand-digitized from the Moderate-resolution Imaging Spectroradiometer (MODIS) mosaic of Antarctica (MOA) image map produced and distributed by the National Snow and Ice Data Center (NSIDC) at: http://nsidc.org/data/nsidc-0280.html. The coastline includes the ice shelves surrounding Antarctica while the grounding line excludes them. Coastlines for islands surrounding Antarctica are provided separately from the rest of Antarctica's grounding line.
snow water equivalent, January (1988-2003) (snow_water_equivalent_01)
The snow water equivalent data set (Armstrong et al., 2005) labels all of Antarctica as permanent ice. The MODIS Mosaic of Antarctica (MOA)-based Antarctic grounding line is used in place of this data set's Antarctic coastline, however, in order for the coastlines to be consistent throughout the Atlas. These sources are documented and cited in their respective layers below.
Antarctic continent (snow_water_equivalent_01_antarctica)
Bohlander, J. and T. Scambos. 2007. Antarctic coastlines and grounding line derived from MODIS Mosaic of Antarctica (MOA). Boulder, Colorado USA: National Snow and Ice Data Center. Digital media. Accessed 24 April 2008. Background: These outlines were hand-digitized from the Moderate-resolution Imaging Spectroradiometer (MODIS) mosaic of Antarctica (MOA) image map produced and distributed by the National Snow and Ice Data Center (NSIDC) at: http://nsidc.org/data/nsidc-0280.html. The coastline includes the ice shelves surrounding Antarctica while the grounding line excludes them. Coastlines for islands surrounding Antarctica are provided separately from the rest of Antarctica's grounding line.
Antarctic islands (snow_water_equivalent_01_antarctica_islands)
Bohlander, J. and T. Scambos. 2007. Antarctic coastlines and grounding line derived from MODIS Mosaic of Antarctica (MOA). Boulder, Colorado USA: National Snow and Ice Data Center. Digital media. Accessed 24 April 2008. Background: These outlines were hand-digitized from the Moderate-resolution Imaging Spectroradiometer (MODIS) mosaic of Antarctica (MOA) image map produced and distributed by the National Snow and Ice Data Center (NSIDC) at: http://nsidc.org/data/nsidc-0280.html. The coastline includes the ice shelves surrounding Antarctica while the grounding line excludes them. Coastlines for islands surrounding Antarctica are provided separately from the rest of Antarctica's grounding line.
snow water equivalent, January (1988-2003) (excluding Antarctica) (snow_water_equivalent_01_excluding_antarctica)
Armstrong, R.L., M.J. Brodzik, K. Knowles, and M. Savoie. 2005. Global monthly EASE-Grid snow water equivalent climatology. Boulder, CO, USA: National Snow and Ice Data Center. Digital media. Available at http://nsidc.org/data/nsidc-0271.html. 30 August 2006. Background: Global, monthly snow water equivalent (SWE) climatologies are generated from passive microwave brightness temperature data derived from Nimbus-7 Scanning Multichannel Microwave Radiometer (SMMR) and Defense Meteorological Satellite Program (DMSP) -F8, -F11 and -F13 Special Sensor Microwave/Imager (SSM/I) radiances and gridded to the Northern and Southern 25 km Equal-Area Scalable Earth Grids (EASE-Grids).
snow water equivalent, February (1988-2003) (snow_water_equivalent_02)
The snow water equivalent data set (Armstrong et al., 2005) labels all of Antarctica as permanent ice. The MODIS Mosaic of Antarctica (MOA)-based Antarctic grounding line is used in place of this data set's Antarctic coastline, however, in order for the coastlines to be consistent throughout the Atlas. These sources are documented and cited in their respective layers below.
Antarctic continent (snow_water_equivalent_02_antarctica)
Bohlander, J. and T. Scambos. 2007. Antarctic coastlines and grounding line derived from MODIS Mosaic of Antarctica (MOA). Boulder, Colorado USA: National Snow and Ice Data Center. Digital media. Accessed 24 April 2008. Background: These outlines were hand-digitized from the Moderate-resolution Imaging Spectroradiometer (MODIS) mosaic of Antarctica (MOA) image map produced and distributed by the National Snow and Ice Data Center (NSIDC) at: http://nsidc.org/data/nsidc-0280.html. The coastline includes the ice shelves surrounding Antarctica while the grounding line excludes them. Coastlines for islands surrounding Antarctica are provided separately from the rest of Antarctica's grounding line.
Antarctic islands (snow_water_equivalent_02_antarctica_islands)
Bohlander, J. and T. Scambos. 2007. Antarctic coastlines and grounding line derived from MODIS Mosaic of Antarctica (MOA). Boulder, Colorado USA: National Snow and Ice Data Center. Digital media. Accessed 24 April 2008. Background: These outlines were hand-digitized from the Moderate-resolution Imaging Spectroradiometer (MODIS) mosaic of Antarctica (MOA) image map produced and distributed by the National Snow and Ice Data Center (NSIDC) at: http://nsidc.org/data/nsidc-0280.html. The coastline includes the ice shelves surrounding Antarctica while the grounding line excludes them. Coastlines for islands surrounding Antarctica are provided separately from the rest of Antarctica's grounding line.
snow water equivalent, February (1988-2003) (excluding Antarctica) (snow_water_equivalent_02_excluding_antarctica)
Armstrong, R.L., M.J. Brodzik, K. Knowles, and M. Savoie. 2005. Global monthly EASE-Grid snow water equivalent climatology. Boulder, CO, USA: National Snow and Ice Data Center. Digital media. Available at http://nsidc.org/data/nsidc-0271.html. 30 August 2006. Background: Global, monthly snow water equivalent (SWE) climatologies are generated from passive microwave brightness temperature data derived from Nimbus-7 Scanning Multichannel Microwave Radiometer (SMMR) and Defense Meteorological Satellite Program (DMSP) -F8, -F11 and -F13 Special Sensor Microwave/Imager (SSM/I) radiances and gridded to the Northern and Southern 25 km Equal-Area Scalable Earth Grids (EASE-Grids).
snow water equivalent, March (1988-2003) (snow_water_equivalent_03)
The snow water equivalent data set (Armstrong et al., 2005) labels all of Antarctica as permanent ice. The MODIS Mosaic of Antarctica (MOA)-based Antarctic grounding line is used in place of this data set's Antarctic coastline, however, in order for the coastlines to be consistent throughout the Atlas. These sources are documented and cited in their respective layers below.
Antarctic continent (snow_water_equivalent_03_antarctica)
Bohlander, J. and T. Scambos. 2007. Antarctic coastlines and grounding line derived from MODIS Mosaic of Antarctica (MOA). Boulder, Colorado USA: National Snow and Ice Data Center. Digital media. Accessed 24 April 2008. Background: These outlines were hand-digitized from the Moderate-resolution Imaging Spectroradiometer (MODIS) mosaic of Antarctica (MOA) image map produced and distributed by the National Snow and Ice Data Center (NSIDC) at: http://nsidc.org/data/nsidc-0280.html. The coastline includes the ice shelves surrounding Antarctica while the grounding line excludes them. Coastlines for islands surrounding Antarctica are provided separately from the rest of Antarctica's grounding line.
Antarctic islands (snow_water_equivalent_03_antarctica_islands)
Bohlander, J. and T. Scambos. 2007. Antarctic coastlines and grounding line derived from MODIS Mosaic of Antarctica (MOA). Boulder, Colorado USA: National Snow and Ice Data Center. Digital media. Accessed 24 April 2008. Background: These outlines were hand-digitized from the Moderate-resolution Imaging Spectroradiometer (MODIS) mosaic of Antarctica (MOA) image map produced and distributed by the National Snow and Ice Data Center (NSIDC) at: http://nsidc.org/data/nsidc-0280.html. The coastline includes the ice shelves surrounding Antarctica while the grounding line excludes them. Coastlines for islands surrounding Antarctica are provided separately from the rest of Antarctica's grounding line.
snow water equivalent, March (1988-2003) (excluding Antarctica) (snow_water_equivalent_03_excluding_antarctica)
Armstrong, R.L., M.J. Brodzik, K. Knowles, and M. Savoie. 2005. Global monthly EASE-Grid snow water equivalent climatology. Boulder, CO, USA: National Snow and Ice Data Center. Digital media. Available at http://nsidc.org/data/nsidc-0271.html. 30 August 2006. Background: Global, monthly snow water equivalent (SWE) climatologies are generated from passive microwave brightness temperature data derived from Nimbus-7 Scanning Multichannel Microwave Radiometer (SMMR) and Defense Meteorological Satellite Program (DMSP) -F8, -F11 and -F13 Special Sensor Microwave/Imager (SSM/I) radiances and gridded to the Northern and Southern 25 km Equal-Area Scalable Earth Grids (EASE-Grids).
snow water equivalent, April (1988-2003) (snow_water_equivalent_04)
The snow water equivalent data set (Armstrong et al., 2005) labels all of Antarctica as permanent ice. The MODIS Mosaic of Antarctica (MOA)-based Antarctic grounding line is used in place of this data set's Antarctic coastline, however, in order for the coastlines to be consistent throughout the Atlas. These sources are documented and cited in their respective layers below.
Antarctic continent (snow_water_equivalent_04_antarctica)
Bohlander, J. and T. Scambos. 2007. Antarctic coastlines and grounding line derived from MODIS Mosaic of Antarctica (MOA). Boulder, Colorado USA: National Snow and Ice Data Center. Digital media. Accessed 24 April 2008. Background: These outlines were hand-digitized from the Moderate-resolution Imaging Spectroradiometer (MODIS) mosaic of Antarctica (MOA) image map produced and distributed by the National Snow and Ice Data Center (NSIDC) at: http://nsidc.org/data/nsidc-0280.html. The coastline includes the ice shelves surrounding Antarctica while the grounding line excludes them. Coastlines for islands surrounding Antarctica are provided separately from the rest of Antarctica's grounding line.
Antarctic islands (snow_water_equivalent_04_antarctica_islands)
Bohlander, J. and T. Scambos. 2007. Antarctic coastlines and grounding line derived from MODIS Mosaic of Antarctica (MOA). Boulder, Colorado USA: National Snow and Ice Data Center. Digital media. Accessed 24 April 2008. Background: These outlines were hand-digitized from the Moderate-resolution Imaging Spectroradiometer (MODIS) mosaic of Antarctica (MOA) image map produced and distributed by the National Snow and Ice Data Center (NSIDC) at: http://nsidc.org/data/nsidc-0280.html. The coastline includes the ice shelves surrounding Antarctica while the grounding line excludes them. Coastlines for islands surrounding Antarctica are provided separately from the rest of Antarctica's grounding line.
snow water equivalent, April (1988-2003) (excluding Antarctica) (snow_water_equivalent_04_excluding_antarctica)
Armstrong, R.L., M.J. Brodzik, K. Knowles, and M. Savoie. 2005. Global monthly EASE-Grid snow water equivalent climatology. Boulder, CO, USA: National Snow and Ice Data Center. Digital media. Available at http://nsidc.org/data/nsidc-0271.html. 30 August 2006. Background: Global, monthly snow water equivalent (SWE) climatologies are generated from passive microwave brightness temperature data derived from Nimbus-7 Scanning Multichannel Microwave Radiometer (SMMR) and Defense Meteorological Satellite Program (DMSP) -F8, -F11 and -F13 Special Sensor Microwave/Imager (SSM/I) radiances and gridded to the Northern and Southern 25 km Equal-Area Scalable Earth Grids (EASE-Grids).
snow water equivalent, May (1988-2003) (snow_water_equivalent_05)
The snow water equivalent data set (Armstrong et al., 2005) labels all of Antarctica as permanent ice. The MODIS Mosaic of Antarctica (MOA)-based Antarctic grounding line is used in place of this data set's Antarctic coastline, however, in order for the coastlines to be consistent throughout the Atlas. These sources are documented and cited in their respective layers below.
Antarctic continent (snow_water_equivalent_05_antarctica)
Bohlander, J. and T. Scambos. 2007. Antarctic coastlines and grounding line derived from MODIS Mosaic of Antarctica (MOA). Boulder, Colorado USA: National Snow and Ice Data Center. Digital media. Accessed 24 April 2008. Background: These outlines were hand-digitized from the Moderate-resolution Imaging Spectroradiometer (MODIS) mosaic of Antarctica (MOA) image map produced and distributed by the National Snow and Ice Data Center (NSIDC) at: http://nsidc.org/data/nsidc-0280.html. The coastline includes the ice shelves surrounding Antarctica while the grounding line excludes them. Coastlines for islands surrounding Antarctica are provided separately from the rest of Antarctica's grounding line.
Antarctic islands (snow_water_equivalent_05_antarctica_islands)
Bohlander, J. and T. Scambos. 2007. Antarctic coastlines and grounding line derived from MODIS Mosaic of Antarctica (MOA). Boulder, Colorado USA: National Snow and Ice Data Center. Digital media. Accessed 24 April 2008. Background: These outlines were hand-digitized from the Moderate-resolution Imaging Spectroradiometer (MODIS) mosaic of Antarctica (MOA) image map produced and distributed by the National Snow and Ice Data Center (NSIDC) at: http://nsidc.org/data/nsidc-0280.html. The coastline includes the ice shelves surrounding Antarctica while the grounding line excludes them. Coastlines for islands surrounding Antarctica are provided separately from the rest of Antarctica's grounding line.
snow water equivalent, May (1988-2003) (excluding Antarctica) (snow_water_equivalent_05_excluding_antarctica)
Armstrong, R.L., M.J. Brodzik, K. Knowles, and M. Savoie. 2005. Global monthly EASE-Grid snow water equivalent climatology. Boulder, CO, USA: National Snow and Ice Data Center. Digital media. Available at http://nsidc.org/data/nsidc-0271.html. 30 August 2006. Background: Global, monthly snow water equivalent (SWE) climatologies are generated from passive microwave brightness temperature data derived from Nimbus-7 Scanning Multichannel Microwave Radiometer (SMMR) and Defense Meteorological Satellite Program (DMSP) -F8, -F11 and -F13 Special Sensor Microwave/Imager (SSM/I) radiances and gridded to the Northern and Southern 25 km Equal-Area Scalable Earth Grids (EASE-Grids).
snow water equivalent, June (1988-2003) (snow_water_equivalent_06)
The snow water equivalent data set (Armstrong et al., 2005) labels all of Antarctica as permanent ice. The MODIS Mosaic of Antarctica (MOA)-based Antarctic grounding line is used in place of this data set's Antarctic coastline, however, in order for the coastlines to be consistent throughout the Atlas. These sources are documented and cited in their respective layers below.
Antarctic continent (snow_water_equivalent_06_antarctica)
Bohlander, J. and T. Scambos. 2007. Antarctic coastlines and grounding line derived from MODIS Mosaic of Antarctica (MOA). Boulder, Colorado USA: National Snow and Ice Data Center. Digital media. Accessed 24 April 2008. Background: These outlines were hand-digitized from the Moderate-resolution Imaging Spectroradiometer (MODIS) mosaic of Antarctica (MOA) image map produced and distributed by the National Snow and Ice Data Center (NSIDC) at: http://nsidc.org/data/nsidc-0280.html. The coastline includes the ice shelves surrounding Antarctica while the grounding line excludes them. Coastlines for islands surrounding Antarctica are provided separately from the rest of Antarctica's grounding line.
Antarctic islands (snow_water_equivalent_06_antarctica_islands)
Bohlander, J. and T. Scambos. 2007. Antarctic coastlines and grounding line derived from MODIS Mosaic of Antarctica (MOA). Boulder, Colorado USA: National Snow and Ice Data Center. Digital media. Accessed 24 April 2008. Background: These outlines were hand-digitized from the Moderate-resolution Imaging Spectroradiometer (MODIS) mosaic of Antarctica (MOA) image map produced and distributed by the National Snow and Ice Data Center (NSIDC) at: http://nsidc.org/data/nsidc-0280.html. The coastline includes the ice shelves surrounding Antarctica while the grounding line excludes them. Coastlines for islands surrounding Antarctica are provided separately from the rest of Antarctica's grounding line.
snow water equivalent, June (1988-2003) (excluding Antarctica) (snow_water_equivalent_06_excluding_antarctica)
Armstrong, R.L., M.J. Brodzik, K. Knowles, and M. Savoie. 2005. Global monthly EASE-Grid snow water equivalent climatology. Boulder, CO, USA: National Snow and Ice Data Center. Digital media. Available at http://nsidc.org/data/nsidc-0271.html. 30 August 2006. Background: Global, monthly snow water equivalent (SWE) climatologies are generated from passive microwave brightness temperature data derived from Nimbus-7 Scanning Multichannel Microwave Radiometer (SMMR) and Defense Meteorological Satellite Program (DMSP) -F8, -F11 and -F13 Special Sensor Microwave/Imager (SSM/I) radiances and gridded to the Northern and Southern 25 km Equal-Area Scalable Earth Grids (EASE-Grids).
snow water equivalent, July (1988-2002) (snow_water_equivalent_07)
The snow water equivalent data set (Armstrong et al., 2005) labels all of Antarctica as permanent ice. The MODIS Mosaic of Antarctica (MOA)-based Antarctic grounding line is used in place of this data set's Antarctic coastline, however, in order for the coastlines to be consistent throughout the Atlas. These sources are documented and cited in their respective layers below.
Antarctic continent (snow_water_equivalent_07_antarctica)
Bohlander, J. and T. Scambos. 2007. Antarctic coastlines and grounding line derived from MODIS Mosaic of Antarctica (MOA). Boulder, Colorado USA: National Snow and Ice Data Center. Digital media. Accessed 24 April 2008. Background: These outlines were hand-digitized from the Moderate-resolution Imaging Spectroradiometer (MODIS) mosaic of Antarctica (MOA) image map produced and distributed by the National Snow and Ice Data Center (NSIDC) at: http://nsidc.org/data/nsidc-0280.html. The coastline includes the ice shelves surrounding Antarctica while the grounding line excludes them. Coastlines for islands surrounding Antarctica are provided separately from the rest of Antarctica's grounding line.
Antarctic islands (snow_water_equivalent_07_antarctica_islands)
Bohlander, J. and T. Scambos. 2007. Antarctic coastlines and grounding line derived from MODIS Mosaic of Antarctica (MOA). Boulder, Colorado USA: National Snow and Ice Data Center. Digital media. Accessed 24 April 2008. Background: These outlines were hand-digitized from the Moderate-resolution Imaging Spectroradiometer (MODIS) mosaic of Antarctica (MOA) image map produced and distributed by the National Snow and Ice Data Center (NSIDC) at: http://nsidc.org/data/nsidc-0280.html. The coastline includes the ice shelves surrounding Antarctica while the grounding line excludes them. Coastlines for islands surrounding Antarctica are provided separately from the rest of Antarctica's grounding line.
snow water equivalent, July (1988-2002) (excluding Antarctica) (snow_water_equivalent_07_excluding_antarctica)
Armstrong, R.L., M.J. Brodzik, K. Knowles, and M. Savoie. 2005. Global monthly EASE-Grid snow water equivalent climatology. Boulder, CO, USA: National Snow and Ice Data Center. Digital media. Available at http://nsidc.org/data/nsidc-0271.html. 30 August 2006. Background: Global, monthly snow water equivalent (SWE) climatologies are generated from passive microwave brightness temperature data derived from Nimbus-7 Scanning Multichannel Microwave Radiometer (SMMR) and Defense Meteorological Satellite Program (DMSP) -F8, -F11 and -F13 Special Sensor Microwave/Imager (SSM/I) radiances and gridded to the Northern and Southern 25 km Equal-Area Scalable Earth Grids (EASE-Grids).
snow water equivalent, August (1987-2002) (snow_water_equivalent_08)
The snow water equivalent data set (Armstrong et al., 2005) labels all of Antarctica as permanent ice. The MODIS Mosaic of Antarctica (MOA)-based Antarctic grounding line is used in place of this data set's Antarctic coastline, however, in order for the coastlines to be consistent throughout the Atlas. These sources are documented and cited in their respective layers below.
Antarctic continent (snow_water_equivalent_08_antarctica)
Bohlander, J. and T. Scambos. 2007. Antarctic coastlines and grounding line derived from MODIS Mosaic of Antarctica (MOA). Boulder, Colorado USA: National Snow and Ice Data Center. Digital media. Accessed 24 April 2008. Background: These outlines were hand-digitized from the Moderate-resolution Imaging Spectroradiometer (MODIS) mosaic of Antarctica (MOA) image map produced and distributed by the National Snow and Ice Data Center (NSIDC) at: http://nsidc.org/data/nsidc-0280.html. The coastline includes the ice shelves surrounding Antarctica while the grounding line excludes them. Coastlines for islands surrounding Antarctica are provided separately from the rest of Antarctica's grounding line.
Antarctic islands (snow_water_equivalent_08_antarctica_islands)
Bohlander, J. and T. Scambos. 2007. Antarctic coastlines and grounding line derived from MODIS Mosaic of Antarctica (MOA). Boulder, Colorado USA: National Snow and Ice Data Center. Digital media. Accessed 24 April 2008. Background: These outlines were hand-digitized from the Moderate-resolution Imaging Spectroradiometer (MODIS) mosaic of Antarctica (MOA) image map produced and distributed by the National Snow and Ice Data Center (NSIDC) at: http://nsidc.org/data/nsidc-0280.html. The coastline includes the ice shelves surrounding Antarctica while the grounding line excludes them. Coastlines for islands surrounding Antarctica are provided separately from the rest of Antarctica's grounding line.
snow water equivalent, August (1987-2002) (excluding Antarctica) (snow_water_equivalent_08_excluding_antarctica)
Armstrong, R.L., M.J. Brodzik, K. Knowles, and M. Savoie. 2005. Global monthly EASE-Grid snow water equivalent climatology. Boulder, CO, USA: National Snow and Ice Data Center. Digital media. Available at http://nsidc.org/data/nsidc-0271.html. 30 August 2006. Background: Global, monthly snow water equivalent (SWE) climatologies are generated from passive microwave brightness temperature data derived from Nimbus-7 Scanning Multichannel Microwave Radiometer (SMMR) and Defense Meteorological Satellite Program (DMSP) -F8, -F11 and -F13 Special Sensor Microwave/Imager (SSM/I) radiances and gridded to the Northern and Southern 25 km Equal-Area Scalable Earth Grids (EASE-Grids).
snow water equivalent, September (1987-2002) (snow_water_equivalent_09)
The snow water equivalent data set (Armstrong et al., 2005) labels all of Antarctica as permanent ice. The MODIS Mosaic of Antarctica (MOA)-based Antarctic grounding line is used in place of this data set's Antarctic coastline, however, in order for the coastlines to be consistent throughout the Atlas. These sources are documented and cited in their respective layers below.
Antarctic continent (snow_water_equivalent_09_antarctica)
Bohlander, J. and T. Scambos. 2007. Antarctic coastlines and grounding line derived from MODIS Mosaic of Antarctica (MOA). Boulder, Colorado USA: National Snow and Ice Data Center. Digital media. Accessed 24 April 2008. Background: These outlines were hand-digitized from the Moderate-resolution Imaging Spectroradiometer (MODIS) mosaic of Antarctica (MOA) image map produced and distributed by the National Snow and Ice Data Center (NSIDC) at: http://nsidc.org/data/nsidc-0280.html. The coastline includes the ice shelves surrounding Antarctica while the grounding line excludes them. Coastlines for islands surrounding Antarctica are provided separately from the rest of Antarctica's grounding line.
Antarctic islands (snow_water_equivalent_09_antarctica_islands)
Bohlander, J. and T. Scambos. 2007. Antarctic coastlines and grounding line derived from MODIS Mosaic of Antarctica (MOA). Boulder, Colorado USA: National Snow and Ice Data Center. Digital media. Accessed 24 April 2008. Background: These outlines were hand-digitized from the Moderate-resolution Imaging Spectroradiometer (MODIS) mosaic of Antarctica (MOA) image map produced and distributed by the National Snow and Ice Data Center (NSIDC) at: http://nsidc.org/data/nsidc-0280.html. The coastline includes the ice shelves surrounding Antarctica while the grounding line excludes them. Coastlines for islands surrounding Antarctica are provided separately from the rest of Antarctica's grounding line.
snow water equivalent, September (1987-2002) (excluding Antarctica) (snow_water_equivalent_09_excluding_antarctica)
Armstrong, R.L., M.J. Brodzik, K. Knowles, and M. Savoie. 2005. Global monthly EASE-Grid snow water equivalent climatology. Boulder, CO, USA: National Snow and Ice Data Center. Digital media. Available at http://nsidc.org/data/nsidc-0271.html. 30 August 2006. Background: Global, monthly snow water equivalent (SWE) climatologies are generated from passive microwave brightness temperature data derived from Nimbus-7 Scanning Multichannel Microwave Radiometer (SMMR) and Defense Meteorological Satellite Program (DMSP) -F8, -F11 and -F13 Special Sensor Microwave/Imager (SSM/I) radiances and gridded to the Northern and Southern 25 km Equal-Area Scalable Earth Grids (EASE-Grids).
snow water equivalent, October (1987-2002) (snow_water_equivalent_10)
The snow water equivalent data set (Armstrong et al., 2005) labels all of Antarctica as permanent ice. The MODIS Mosaic of Antarctica (MOA)-based Antarctic grounding line is used in place of this data set's Antarctic coastline, however, in order for the coastlines to be consistent throughout the Atlas. These sources are documented and cited in their respective layers below.
Antarctic continent (snow_water_equivalent_10_antarctica)
Bohlander, J. and T. Scambos. 2007. Antarctic coastlines and grounding line derived from MODIS Mosaic of Antarctica (MOA). Boulder, Colorado USA: National Snow and Ice Data Center. Digital media. Accessed 24 April 2008. Background: These outlines were hand-digitized from the Moderate-resolution Imaging Spectroradiometer (MODIS) mosaic of Antarctica (MOA) image map produced and distributed by the National Snow and Ice Data Center (NSIDC) at: http://nsidc.org/data/nsidc-0280.html. The coastline includes the ice shelves surrounding Antarctica while the grounding line excludes them. Coastlines for islands surrounding Antarctica are provided separately from the rest of Antarctica's grounding line.
Antarctic islands (snow_water_equivalent_10_antarctica_islands)
Bohlander, J. and T. Scambos. 2007. Antarctic coastlines and grounding line derived from MODIS Mosaic of Antarctica (MOA). Boulder, Colorado USA: National Snow and Ice Data Center. Digital media. Accessed 24 April 2008. Background: These outlines were hand-digitized from the Moderate-resolution Imaging Spectroradiometer (MODIS) mosaic of Antarctica (MOA) image map produced and distributed by the National Snow and Ice Data Center (NSIDC) at: http://nsidc.org/data/nsidc-0280.html. The coastline includes the ice shelves surrounding Antarctica while the grounding line excludes them. Coastlines for islands surrounding Antarctica are provided separately from the rest of Antarctica's grounding line.
snow water equivalent, October (1987-2002) (excluding Antarctica) (snow_water_equivalent_10_excluding_antarctica)
Armstrong, R.L., M.J. Brodzik, K. Knowles, and M. Savoie. 2005. Global monthly EASE-Grid snow water equivalent climatology. Boulder, CO, USA: National Snow and Ice Data Center. Digital media. Available at http://nsidc.org/data/nsidc-0271.html. 30 August 2006. Background: Global, monthly snow water equivalent (SWE) climatologies are generated from passive microwave brightness temperature data derived from Nimbus-7 Scanning Multichannel Microwave Radiometer (SMMR) and Defense Meteorological Satellite Program (DMSP) -F8, -F11 and -F13 Special Sensor Microwave/Imager (SSM/I) radiances and gridded to the Northern and Southern 25 km Equal-Area Scalable Earth Grids (EASE-Grids).
snow water equivalent, November (1987-2002) (snow_water_equivalent_11)
The snow water equivalent data set (Armstrong et al., 2005) labels all of Antarctica as permanent ice. The MODIS Mosaic of Antarctica (MOA)-based Antarctic grounding line is used in place of this data set's Antarctic coastline, however, in order for the coastlines to be consistent throughout the Atlas. These sources are documented and cited in their respective layers below.
Antarctic continent (snow_water_equivalent_11_antarctica)
Bohlander, J. and T. Scambos. 2007. Antarctic coastlines and grounding line derived from MODIS Mosaic of Antarctica (MOA). Boulder, Colorado USA: National Snow and Ice Data Center. Digital media. Accessed 24 April 2008. Background: These outlines were hand-digitized from the Moderate-resolution Imaging Spectroradiometer (MODIS) mosaic of Antarctica (MOA) image map produced and distributed by the National Snow and Ice Data Center (NSIDC) at: http://nsidc.org/data/nsidc-0280.html. The coastline includes the ice shelves surrounding Antarctica while the grounding line excludes them. Coastlines for islands surrounding Antarctica are provided separately from the rest of Antarctica's grounding line.
Antarctic islands (snow_water_equivalent_11_antarctica_islands)
Bohlander, J. and T. Scambos. 2007. Antarctic coastlines and grounding line derived from MODIS Mosaic of Antarctica (MOA). Boulder, Colorado USA: National Snow and Ice Data Center. Digital media. Accessed 24 April 2008. Background: These outlines were hand-digitized from the Moderate-resolution Imaging Spectroradiometer (MODIS) mosaic of Antarctica (MOA) image map produced and distributed by the National Snow and Ice Data Center (NSIDC) at: http://nsidc.org/data/nsidc-0280.html. The coastline includes the ice shelves surrounding Antarctica while the grounding line excludes them. Coastlines for islands surrounding Antarctica are provided separately from the rest of Antarctica's grounding line.
snow water equivalent, November (1987-2002) (excluding Antarctica) (snow_water_equivalent_11_excluding_antarctica)
Armstrong, R.L., M.J. Brodzik, K. Knowles, and M. Savoie. 2005. Global monthly EASE-Grid snow water equivalent climatology. Boulder, CO, USA: National Snow and Ice Data Center. Digital media. Available at http://nsidc.org/data/nsidc-0271.html. 30 August 2006. Background: Global, monthly snow water equivalent (SWE) climatologies are generated from passive microwave brightness temperature data derived from Nimbus-7 Scanning Multichannel Microwave Radiometer (SMMR) and Defense Meteorological Satellite Program (DMSP) -F8, -F11 and -F13 Special Sensor Microwave/Imager (SSM/I) radiances and gridded to the Northern and Southern 25 km Equal-Area Scalable Earth Grids (EASE-Grids).
snow water equivalent, December (1987-2002) (snow_water_equivalent_12)
The snow water equivalent data set (Armstrong et al., 2005) labels all of Antarctica as permanent ice. The MODIS Mosaic of Antarctica (MOA)-based Antarctic grounding line is used in place of this data set's Antarctic coastline, however, in order for the coastlines to be consistent throughout the Atlas. These sources are documented and cited in their respective layers below.
Antarctic continent (snow_water_equivalent_12_antarctica)
Bohlander, J. and T. Scambos. 2007. Antarctic coastlines and grounding line derived from MODIS Mosaic of Antarctica (MOA). Boulder, Colorado USA: National Snow and Ice Data Center. Digital media. Accessed 24 April 2008. Background: These outlines were hand-digitized from the Moderate-resolution Imaging Spectroradiometer (MODIS) mosaic of Antarctica (MOA) image map produced and distributed by the National Snow and Ice Data Center (NSIDC) at: http://nsidc.org/data/nsidc-0280.html. The coastline includes the ice shelves surrounding Antarctica while the grounding line excludes them. Coastlines for islands surrounding Antarctica are provided separately from the rest of Antarctica's grounding line.
Antarctic islands (snow_water_equivalent_12_antarctica_islands)
Bohlander, J. and T. Scambos. 2007. Antarctic coastlines and grounding line derived from MODIS Mosaic of Antarctica (MOA). Boulder, Colorado USA: National Snow and Ice Data Center. Digital media. Accessed 24 April 2008. Background: These outlines were hand-digitized from the Moderate-resolution Imaging Spectroradiometer (MODIS) mosaic of Antarctica (MOA) image map produced and distributed by the National Snow and Ice Data Center (NSIDC) at: http://nsidc.org/data/nsidc-0280.html. The coastline includes the ice shelves surrounding Antarctica while the grounding line excludes them. Coastlines for islands surrounding Antarctica are provided separately from the rest of Antarctica's grounding line.
snow water equivalent, December (1987-2002) (excluding Antarctica) (snow_water_equivalent_12_excluding_antarctica)
Armstrong, R.L., M.J. Brodzik, K. Knowles, and M. Savoie. 2005. Global monthly EASE-Grid snow water equivalent climatology. Boulder, CO, USA: National Snow and Ice Data Center. Digital media. Available at http://nsidc.org/data/nsidc-0271.html. 30 August 2006. Background: Global, monthly snow water equivalent (SWE) climatologies are generated from passive microwave brightness temperature data derived from Nimbus-7 Scanning Multichannel Microwave Radiometer (SMMR) and Defense Meteorological Satellite Program (DMSP) -F8, -F11 and -F13 Special Sensor Microwave/Imager (SSM/I) radiances and gridded to the Northern and Southern 25 km Equal-Area Scalable Earth Grids (EASE-Grids).
Antarctic snow accumulation (antarctica_accumulation)
An outline of the Antarctic ice shelves is grouped together with the Antarctic snow accumulation layer (Arthern et al., 2006) so that this border remains visible in the Atlas of the Cryosphere. These sources are documented and cited in their respective layers below.
Antarctic snow accumulation (without ice shelf outline) (antarctica_accumulation_without_coastline)
Arthern, R.J., D.P. Winebrenner, and D.G. Vaughan. 2006. Antarctic snow accumulation mapped using polarization of 4.3-cm wavelength microwave emission. Journal of Geophysical Research. 111, D06107, doi:10.1029/2004JD005667. Data provided by the British Antarctic Survery, Cambridge, UK. Available at http://www.antarctica.ac.uk/Resources/PSD/snow_accumulation/. 27 October 2006. Background: The map of Antarctic snow accumulation is derived from a compilation of field measurements. Satellite observations from AMSR-E and AVHRR instruments are used to guide the interpolation. The effective resolution of the map is approximately 100 km. The estimates of root mean square percentage error apply to regional averages at scales of around 100 km by 100 km. On smaller scales, additional deviations of 30% r.m.s. are likely. Values for locations subject to melt may be unreliable. From this map we obtain a value of 143 +/- 4 mm per year for the average rate of snow accumulation upon the grounded ice sheet of Antarctica.
Antarctic ice shelves outline (antarctica_accumulation_ice_shelves_outline)
Bohlander, J. and T. Scambos. 2007. Antarctic coastlines and grounding line derived from MODIS Mosaic of Antarctica (MOA). Boulder, Colorado USA: National Snow and Ice Data Center. Digital media. Accessed 24 April 2008. Background: These outlines were hand-digitized from the Moderate-resolution Imaging Spectroradiometer (MODIS) mosaic of Antarctica (MOA) image map produced and distributed by the National Snow and Ice Data Center (NSIDC) at: http://nsidc.org/data/nsidc-0280.html. The coastline includes the ice shelves surrounding Antarctica while the grounding line excludes them. Coastlines for islands surrounding Antarctica are provided separately from the rest of Antarctica's grounding line.
Antarctica bedrock elevation (antarctica_bedrock_elevation)
Lythe, M. B., D. G. Vaughan, and the BEDMAP Consortium. 2000. BEDMAP - bed topography of the Antarctic. Cambridge, United Kingdom: British Antarctic Survey. Digital Media. Available at http://www.antarctica.ac.uk//bas_research/data/access/bedmap/. Accessed 28 June 2008. Background: The BEDMAP project was conceived as an attempt to rationalise the coverage of ice thickness measurements over Antarctica, collect the data together and produce a new topographic model of the bed of the Antarctic Ice Sheet, to provide a new basis for all aspects of Antarctic geoscience. Includes the entire area south of 60 degrees south latitude. Resolution: 5 km. Time Period: 1951-1999. Sources: ground-based and airborne surveys, primarily from radar and seismic sounding as well as gravimetric measurements. Elevations are relative to the OSU91A geoid.
Antarctic surface elevation (antarctica_elevation)
In order for the coastlines to be consistent throughout the Atlas, the MOA-based Antarctic ice shelves coastline displayed in the Atlas of the Cryosphere is used as the outer limit of data displayed in the RAMP V2 Antarctic surface elevation data set (Liu et al., 2001). The MOA-based Antarctic coastline is filled in and outlined to give the ice shelves a different color from the rest of the surface elevation map. Only elevations greater than or equal to 100 m are displayed in the surface elevation map, and the MOA-based coastline is used as the backdrop color for the excluded, lower elevations. These sources are documented and cited in their respective layers below.
Antarctic ice shelves (antarctica_elevation_ice_shelves_fill)
Bohlander, J. and T. Scambos. 2007. Antarctic coastlines and grounding line derived from MODIS Mosaic of Antarctica (MOA). Boulder, Colorado USA: National Snow and Ice Data Center. Digital media. Accessed 24 April 2008. Background: These outlines were hand-digitized from the Moderate-resolution Imaging Spectroradiometer (MODIS) mosaic of Antarctica (MOA) image map produced and distributed by the National Snow and Ice Data Center (NSIDC) at: http://nsidc.org/data/nsidc-0280.html. The coastline includes the ice shelves surrounding Antarctica while the grounding line excludes them. Coastlines for islands surrounding Antarctica are provided separately from the rest of Antarctica's grounding line.
Antarctic ice shelves (outline) (antarctica_elevation_ice_shelves_outline)
Bohlander, J. and T. Scambos. 2007. Antarctic coastlines and grounding line derived from MODIS Mosaic of Antarctica (MOA). Boulder, Colorado USA: National Snow and Ice Data Center. Digital media. Accessed 24 April 2008. Background: These outlines were hand-digitized from the Moderate-resolution Imaging Spectroradiometer (MODIS) mosaic of Antarctica (MOA) image map produced and distributed by the National Snow and Ice Data Center (NSIDC) at: http://nsidc.org/data/nsidc-0280.html. The coastline includes the ice shelves surrounding Antarctica while the grounding line excludes them. Coastlines for islands surrounding Antarctica are provided separately from the rest of Antarctica's grounding line.
Antarctic suface elevation (above 100 m) (antarctica_elevation_above_100m)
Liu, H., K. Jezek, B. Li, and Z. Zhao. 2001. Radarsat Antarctic Mapping Project digital elevation model version 2. Boulder, CO, USA: National Snow and Ice Data Center. Digital media. Available at http://nsidc.org/data/nsidc-0082.html. 01 November 2006. Background: The high-resolution Radarsat Antarctic Mapping Project (RAMP) Digital Elevation Model (DEM) combines topographic data from a variety of sources to provide consistent coverage of all of Antarctica. Version 2 improves upon the original version by incorporating new topographic data, error corrections, extended coverage, and other modifications. The DEM incorporates topographic data from satellite radar altimetry, airborne radar surveys, the recently-updated Antarctic Digital Database (version 2), and large-scale topographic maps from the U.S. Geological Survey (USGS) and the Australian Antarctic Division. Data were collected between the 1940s and present, with most collected during the 1980s and 1990s. Although the RAMP DEM was created to aid in processing RAMP radar data, it does not utilize any RAMP radar data. The Atlas of the Cryosphere uses the RAMP DEM gridded at 1 km.
Antarctic suface elevation contours (antarctica_elevation_contours)
Liu, H., K. Jezek, B. Li, and Z. Zhao. 2001. Radarsat Antarctic Mapping Project digital elevation model version 2. Boulder, CO, USA: National Snow and Ice Data Center. Digital media. Available at http://nsidc.org/data/nsidc-0082.html. 01 November 2006. Background: The high-resolution Radarsat Antarctic Mapping Project (RAMP) Digital Elevation Model (DEM) combines topographic data from a variety of sources to provide consistent coverage of all of Antarctica. Version 2 improves upon the original version by incorporating new topographic data, error corrections, extended coverage, and other modifications. The DEM incorporates topographic data from satellite radar altimetry, airborne radar surveys, the recently-updated Antarctic Digital Database (version 2), and large-scale topographic maps from the U.S. Geological Survey (USGS) and the Australian Antarctic Division. Data were collected between the 1940s and present, with most collected during the 1980s and 1990s. Although the RAMP DEM was created to aid in processing RAMP radar data, it does not utilize any RAMP radar data. The Atlas of the Cryosphere uses the RAMP DEM gridded at 1 km.
glaciers (glaciers)
National Imagery and Mapping Agency (NIMA). 1992. VMAP_1V10 - Vector Map Level 0 (Digital Chart of the World). Bethesda, MD, USA: National Imagery and Mapping Agency (NIMA). Available at http://www.maproom.psu.edu/dcw/ and http://webgis.wr.usgs.gov/globalgis/. 01 September 2000. Background: The primary source for this database is the U.S. Defense Mapping Agency's (DMA) Operational Navigation Chart (ONC) 1:1,000,000 scale paper map series produced by the United States, Australia, Canada, and the United Kingdom. These charts were designed to meet the needs of pilots and air crews in medium-and low-altitude en route navigation and to support military operational planning, intelligence briefings, and other needs. Level 0 (low resolution) coverage is global, and is entirely in the public domain. The National Imagery and Mapping Agency (NIMA) is a federal agency of the United States Government and is now known as the National Geospatial-Intelligence Agency (NGA).
glacier outlines (glacier_outlines)
Armstrong, R., B. Raup, S.J.S. Khalsa, R. Barry, J. Kargel, C. Helm, and H. Kiefer. 2005. GLIMS glacier database. Boulder, CO, USA: National Snow and Ice Data Center. Available at http://nsidc.org/data/nsidc-0272.html. 24 August 2006. Background: Global Land Ice Measurements from Space (GLIMS) is an international project with the goal of surveying a majority of the world's estimated 160,000 glaciers. GLIMS uses data collected primarily by the Advanced Spaceborne Thermal Emission and Reflection Radiometer (ASTER) instrument aboard the Terra satellite and the LANDSAT Enhanced Thematic Mapper Plus (ETM+), along with historical observations. The GLIMS project is currently creating a unique glacier inventory, storing information about the extent and rates of change of all the world's glacial resources. GLIMS consists of many institutions called Regional Centers, who produce glacier analyses for their particular region. The GLIMS Glacier Database provides students, educators, scientists, and the public with reliable glacier data from these analyses. New glacier data are continually being added to the database.
coastlines (coastlines)
Four separate layers are used to map coastlines in the Southern Hemisphere: (1.) the Gridded Population of the World Version 3 (GPWv3) for everyth ing but Antarctica; and NSIDC's MODIS Mosaic of Antarctica (MOA)-based polygons for Antarctica's (2.) islands, (3.) grounding line or continent (excludes the ice shelves), and (4 .) coastline (includes the ice shelves). These sources are documented and cited in their respective layers below.
coastlines (excluding Antarctica) (coastlines_excluding_antarctica)
Center for International Earth Science Information Network (CIESIN), Columbia University; and Centro Internacional de Agricultura Tropical (CIAT). 2005. Gridded Population of the World Version 3 (GPWv3): Coastlines. Palisades, NY, USA: Socioeconomic Data and Applications Center (SEDAC), Columbia University. Available at http://sedac.ciesin.columbia.edu/gpw. 19 January 2007. Background: Coastlines derived from the Gridded Population of the World (GPW) land area grid at 2.5 arc-minute resolution. Permanent ice and all but large lakes have been merged with neighbouring polygons to make a layer more appropriate for cartographic visualization of the data. Does not include Antarctica.
Antarctic coastline (includes ice shelves) (antarctic_ice_shelves_outline)
Bohlander, J. and T. Scambos. 2007. Antarctic coastlines and grounding line derived from MODIS Mosaic of Antarctica (MOA). Boulder, Colorado USA: National Snow and Ice Data Center. Digital media. Accessed 24 April 2008. Background: These outlines were hand-digitized from the Moderate-resolution Imaging Spectroradiometer (MODIS) mosaic of Antarctica (MOA) image map produced and distributed by the National Snow and Ice Data Center (NSIDC) at: http://nsidc.org/data/nsidc-0280.html. The coastline includes the ice shelves surrounding Antarctica while the grounding line excludes them. Coastlines for islands surrounding Antarctica are provided separately from the rest of Antarctica's grounding line.
Antarctic grounding line (excludes ice shelves) (antarctic_coastline)
Bohlander, J. and T. Scambos. 2007. Antarctic coastlines and grounding line derived from MODIS Mosaic of Antarctica (MOA). Boulder, Colorado USA: National Snow and Ice Data Center. Digital media. Accessed 24 April 2008. Background: These outlines were hand-digitized from the Moderate-resolution Imaging Spectroradiometer (MODIS) mosaic of Antarctica (MOA) image map produced and distributed by the National Snow and Ice Data Center (NSIDC) at: http://nsidc.org/data/nsidc-0280.html. The coastline includes the ice shelves surrounding Antarctica while the grounding line excludes them. Coastlines for islands surrounding Antarctica are provided separately from the rest of Antarctica's grounding line.
Antarctic island coastlines (antarctic_islands_coastlines)
Bohlander, J. and T. Scambos. 2007. Antarctic coastlines and grounding line derived from MODIS Mosaic of Antarctica (MOA). Boulder, Colorado USA: National Snow and Ice Data Center. Digital media. Accessed 24 April 2008. Background: These outlines were hand-digitized from the Moderate-resolution Imaging Spectroradiometer (MODIS) mosaic of Antarctica (MOA) image map produced and distributed by the National Snow and Ice Data Center (NSIDC) at: http://nsidc.org/data/nsidc-0280.html. The coastline includes the ice shelves surrounding Antarctica while the grounding line excludes them. Coastlines for islands surrounding Antarctica are provided separately from the rest of Antarctica's grounding line.
countries (country_borders)
Three separate layers are used to map countries in the Southern Hemisphere: (1.) the Gridded Population of the World Version 3 (GPWv3) for everything but Antarctica; and NSIDC's MODIS Mosaic of Antarctica (MOA)-based polygons for Antarctica's (2.) grounding line or continent (excludes the ice shelves) and (3.) island coast lines. These sources are documented and cited in their respective layers below.
countries (excluding Antarctica) (country_borders_excluding_antarctica)
Center for International Earth Science Information Network (CIESIN), Columbia University; and Centro Internacional de Agricultura Tropical (CIAT). 2005. Gridded Population of the World Version 3 (GPWv3): National Boundaries. Palisades, NY, USA: Socioeconomic Data and Applications Center (SEDAC), Columbia University. Available at http://sedac.ciesin.columbia.edu/gpw. 19 January 2007. Background: National boundaries derived from the Gridded Population of the World (GPW) country-level land area grids at 2.5 arc-minute resolution. Permanent ice and all but large lakes have been merged with neighbouring polygons to make a layer more appropriate for cartographic visualization of the data. Does not include Antarctica.
Antarctica border (antarctica_country_border)
Bohlander, J. and T. Scambos. 2007. Antarctic coastlines and grounding line derived from MODIS Mosaic of Antarctica (MOA). Boulder, Colorado USA: National Snow and Ice Data Center. Digital media. Accessed 24 April 2008. Background: These outlines were hand-digitized from the Moderate-resolution Imaging Spectroradiometer (MODIS) mosaic of Antarctica (MOA) image map produced and distributed by the National Snow and Ice Data Center (NSIDC) at: http://nsidc.org/data/nsidc-0280.html. The coastline includes the ice shelves surrounding Antarctica while the grounding line excludes them. Coastlines for islands surrounding Antarctica are provided separately from the rest of Antarctica's grounding line.
Antarctic island coastlines (antarctica_islands_coastlines)
Bohlander, J. and T. Scambos. 2007. Antarctic coastlines and grounding line derived from MODIS Mosaic of Antarctica (MOA). Boulder, Colorado USA: National Snow and Ice Data Center. Digital media. Accessed 24 April 2008. Background: These outlines were hand-digitized from the Moderate-resolution Imaging Spectroradiometer (MODIS) mosaic of Antarctica (MOA) image map produced and distributed by the National Snow and Ice Data Center (NSIDC) at: http://nsidc.org/data/nsidc-0280.html. The coastline includes the ice shelves surrounding Antarctica while the grounding line excludes them. Coastlines for islands surrounding Antarctica are provided separately from the rest of Antarctica's grounding line.
country labels (country_labels)
Labels countries using the Gridded Population of the World Version 3 (GPWv3). Because Antarctica is excluded from this data set (because of its negligible population), Antarctica is labeled separately. These sources are documented and cited in their respective layers below.
country labels (excluding Antarctica) (country_labels_excluding_antarctica)
Center for International Earth Science Information Network (CIESIN), Columbia University; and Centro Internacional de Agricultura Tropical (CIAT). 2005. Gridded Population of the World Version 3 (GPWv3): National Boundaries. Palisades, NY, USA: Socioeconomic Data and Applications Center (SEDAC), Columbia University. Available at http://sedac.ciesin.columbia.edu/gpw. 19 January 2007. Background: National boundaries derived from the Gridded Population of the World (GPW) country-level land area grids at 2.5 arc-minute resolution. Permanent ice and all but large lakes have been merged with neighbouring polygons to make a layer more appropriate for cartographic visualization of the data. Does not include Antarctica.
Antarctica label (antarctica_label)
Labels Antarctica since it is excluded in the GPWv3 national boundaries data set.
Antarctic Polar Front (antarctic_polar_front)
Orsi, A. and Ryan, U. 2001. Locations of the various fronts in the Southern Ocean. Kingston, Tasmania, Australia: Australian Antarctic Data Centre. Digital media. Available at http://aadc-maps.aad.gov.au/aadc/metadata/metadata_redirect.cfm?md=AMD/AU/southern_ocean_fronts. 28 September 2006. Background: Hydrographic observations were used in this study of the Southern Ocean to improve our knowledge of large-scale aspects of the Antarctic Circumpolar Current (ACC). The Antarctic Polar Front, also known as the Antarctic Convergence, is the southern front of the Antarctic Circumpolar Current that separates the Antarctic Zone in the south from the Polar Frontal Zone in the north. The Polar Front is taken by many to delineate the actual northern boundary of the Antarctic Zone. It is characterized by sea surface temperatures near 5-6 deg C and a salinity minimum of 33.8-34.0 psu produced by high rainfall.
x/y grid (in meters) (x_y_grid_laea)
This layer displays an x/y grid in meters for the lambert azimuthal equal-area projection used in the Atlas of the Cryosphere web interface. This rectangular coordinate system shows the planar distance in meters from the map projection origin in the x and y dimensions. The distances are displayed in exponential notation: e.g. 2.5e+06, which is the same as 2.5x10^6 or 2,500,000 meters. The map origin is at the South Pole (-90° ) in this case, so x values above this position on the map are positive and those below it are negative; similarly, y values to the right of the South Pole are positive while those to the left are negative. The maximum extent (min x, min y, max x, max y) is: -9036842.762 m, -9036842.762 m, 9036842.762 m, 9036842.762 m.
x/y grid (in meters) (x_y_grid_epsg3031)
This layer displays an x/y grid in meters for the polar stereographic projection defined by EPSG 3031, available in the Web Map Service (WMS) for the Atlas of the Cryosphere. This rectangular coordinate system shows the planar distance in meters from the map projection origin in the x and y dimensions. The distances are displayed in exponential notation: e.g. 2.5e+06, which is the same as 2.5x10^6 or 2,500,000 meters. The map origin is at the South Pole (-90° ) in this case, so x values above this position on the map are positive and those below it are negative; similarly, y values to the right of the South Pole are positive while those to the left are negative. The maximum extent (min x, min y, max x, max y) is: -12500000 m, -12500000 m, 12500000 m, 12500000 m.
latitude/longitude grid (graticule) (lat_long_grid)
The latitude/longitude grid (a.k.a. graticule) is provided at three resolutions depending on the current map scale: 20° (lat_long_grid_20), 10° (lat_long_grid_10), and 5° (lat_long_grid_5). Citations are provided for each of these layers below.
latitude/longitude grid (graticule) (20°) (lat_long_grid_20)
Environmental Systems Research Institute, Inc. (ESRI). 2000. Graticule. Series: ESRI Data & Maps. Redlands, CA, USA: Environmental Systems Research Institute, Inc. (ESRI). Available at http://webgis.wr.usgs.gov/globalgis/. 01 February 2001.
latitude/longitude grid (graticule) (10°) (lat_long_grid_10)
Environmental Systems Research Institute, Inc. (ESRI). 2000. Graticule. Series: ESRI Data & Maps. Redlands, CA, USA: Environmental Systems Research Institute, Inc. (ESRI). Available at http://webgis.wr.usgs.gov/globalgis/. 01 February 2001.
latitude/longitude grid (graticule) (5°) (lat_long_grid_5)
Environmental Systems Research Institute, Inc. (ESRI). 2000. Graticule. Series: ESRI Data & Maps. Redlands, CA, USA: Environmental Systems Research Institute, Inc. (ESRI). Available at http://webgis.wr.usgs.gov/globalgis/. 01 February 2001.
Antarctic Circle (antarctic_circle)
The Antarctic Circle is the line of latitude 66°34'S (often taken as 66.5°S). Along this line, the sun does not set on the day of the summer solstice, and does not rise on the day of the winter solstice. It is defined here as 66.56°S.
Tropic of Capricorn (tropic_of_capricorn)
The Tropic of Capricorn is the southern parallel of maximum solar declination, approximately 23°27'S latitude. It is the farthest southern latitude at which the sun can appear directly overhead, which occurs on the day of the summer solstice. It is defined here as 23.44°S.
Equator (equator)
The Equator is the line of latitude 0°, which is equidistant from the poles, and which separates the Northern Hemisphere from the Southern Hemisphere.
International Date Line (international_date_line)
National Geographic Society. 1992. National Geographic Atlas of the World, Revised Sixth Edition. Washington, D.C. USA: National Geographic Society. Compiled by J. Maurer. 2007. Boulder, Colorado USA: National Snow and Ice Data Center. Digital Media. Background: The International Date Line (IDL), also known as just the Date Line, is an imaginary line on the surface of the Earth opposite the Prime Meridian which offsets the date as one travels east or west across it. Roughly along 180 deg longitude, with diversions to pass around some territories and island groups, it corresponds to the time zone boundary separating +12 and -12 hours GMT (UT1). Crossing the IDL travelling east results in a day or 24 hours being subtracted, and crossing west results in a day being added.
Prime Meridian (prime_meridian)
The Prime Meridian is the 0 degree line of longitude, which separates the Western Hemisphere from the Eastern Hemisphere.
Antarctic megadunes (antarctic_megadunes)
Bohlander, J. and T. Scambos. 2005. Outlines of Antarctic megadunes regions. Boulder, CO, USA: National Snow and Ice Data Center. Background: Unlike snow dunes that are piles of drifted snow, Antarctic megadunes are long, undulating waves in the surface of the ice sheet that are 2 to 4 meters (6.5 to 13 feet) high and 2 to 5 kilometers (1 to 3 miles) apart. They are slightly rounded at their crests and are so subtle that a person on the ground cannot see the pattern. Regions of megadunes on the Antarctic ice sheet have been identified and outlined using satellite remote sensing imagery.
Antarctic territorial claims (antarctic_territorial_claims)
Wikipedia contributors. 13 January 2007. Antarctic territorial claims. Wikipedia, The Free Encyclopedia. Available at http://en.wikipedia.org/wiki/Antarctic_territorial_claims. 24 January 2007. Background: Currently there are seven claimant nations who maintain a territorial claim on eight territories in Antarctica: Argentina (1943), Australia (1933), Chile (1940), France (1924), New Zealand (1923), Norway (1929, 1939), and the United Kingdom (1908). These countries have tended to site their scientific observation and study facilities in Antarctica within their claimed territory. It is sometimes stated that the Antarctic Treaty (1961) defers or suspends these claims. However, Article IV of the treaty, which deals with the issue of territorial claims, merely specifies that previously asserted claims are not affected by the treaty. The Soviet Union and the United States both filed reservations against the restriction on new claims, and the United States and Russia assert their right to make claims in the future if they so choose. In general, territorial claims below the 60°S parallel have only been recognised between those countries making claims in the area. However, claims are often indicated on maps of Antarctica: this does not signify de jure recognition.
Antarctic territorial claim, France (antarctic_territorial_claims_france)
Wikipedia contributors. 13 January 2007. Antarctic territorial claims. Wikipedia, The Free Encyclopedia. Available at http://en.wikipedia.org/wiki/Antarctic_territorial_claims. 24 January 2007. Background: France's Antarctic territorial claim dates dates back to 1924 and covers all land south of 60°S between 142°2'E and 136°11'E.
Antarctic territorial claim, Argentina (antarctic_territorial_claims_argentina)
Wikipedia contributors. 13 January 2007. Antarctic territorial claims. Wikipedia, The Free Encyclopedia. Available at http://en.wikipedia.org/wiki/Antarctic_territorial_claims. 24 January 2007. Background: Argentina's Antarctic territorial claim dates dates back to 1943 and covers all land south of 60°S between 25°W and 74°W.
Antarctic territorial claim, Australia (antarctic_territorial_claims_australia)
Wikipedia contributors. 13 January 2007. Antarctic territorial claims. Wikipedia, The Free Encyclopedia. Available at http://en.wikipedia.org/wiki/Antarctic_territorial_claims. 24 January 2007. Background: Australia's Antarctic territorial claim dates dates back to 1933 and covers all land south of 60°S between 160°E to 142°2'E and between 136°11'E to 44°38'E.
Antarctic territorial claim, Chile (antarctic_territorial_claims_chile)
Wikipedia contributors. 13 January 2007. Antarctic territorial claims. Wikipedia, The Free Encyclopedia. Available at http://en.wikipedia.org/wiki/Antarctic_territorial_claims. 24 January 2007. Background: Chile's Antarctic territorial claim dates dates back to 1940 and covers all land south of 60°S between 53°W and 90°W.
Antarctic territorial claim, United Kingdom (antarctic_territorial_claims_uk)
Wikipedia contributors. 13 January 2007. Antarctic territorial claims. Wikipedia, The Free Encyclopedia. Available at http://en.wikipedia.org/wiki/Antar ctic_territorial_claims. 24 January 2007. Background: The United Kingdom's Antarctic territorial claim dates dates back to 1908 and covers all land south of 60°S between 20°W and 80°W.
Antarctic territorial claim, Norway (antarctic_territorial_claims_norway)
Wikipedia contributors. 13 January 2007. Antarctic territorial claims. Wikipedia, The Free Encyclopedia. Available at http://en.wikipedia.org/wiki/Antar ctic_territorial_claims. 24 January 2007. Background: Norway's Antarctic territorial claim dates dates back to 1939 and covers all land between 44°38'E and 20°W. The claim does not defined its northern or southern boundaries. Norway also claims Peter I Island (68°50'S 90°35'W) (1929), which is not included in this layer.
Antarctic territorial claim, Norway (undefined northern limit) (antarctic_territorial_claims_norway_limit)
Wikipedia contributors. 13 January 2007. Antarctic territorial claims. Wikipedia, The Free Encyclopedia. Available at http://en.wikipedia.org/wiki/Antarctic_territorial_claims. 24 January 2007. Background: Norway's Antarctic territorial claim dates dates back to 1939 and covers all land between 44°38'E and 20°W. The claim does not defined its northern or southern boundaries. Norway also claims Peter I Island (68°50'S 90°35'W) (1929), which is not included in this layer. This layer provides a dashed arc at 60°S latitude to indicate the undefined northern limit of Norway's main territorial claim.
Antarctic territorial claim, Norway (label) (antarctic_territorial_claims_norway_label)
Wikipedia contributors. 13 January 2007. Antarctic territorial claims. Wikipedia, The Free Encyclopedia. Available at http://en.wikipedia.org/wiki/Antarctic_territorial_claims. 24 January 2007. Background: Norway's Antarctic territorial claim dates dates back to 1939 and covers all land between 44°38'E and 20°W. The claim does not defined its northern or southern boundaries. Norway also claims Peter I Island (68°50'S 90°35'W) (1929), which is not included in this layer. This layer provides a label for Norway's main territorial claim since it could not be included in the previous non-polygon layers.
Antarctic territorial claim, New Zealand (antarctic_territorial_claims_new_zealand)
Wikipedia contributors. 13 January 2007. Antarctic territorial claims. Wikipedia, The Free Encyclopedia. Available at http://en.wikipedia.org/wiki/Antarctic_territorial_claims. 24 January 2007. Background: New Zealand's Antarctic territorial claim dates dates back to 1923 and covers all land south of 60°S between 150°W and 160°E.
cities (major_cities)
Environmental Systems Research Institute, Inc. (ESRI). 2000. World Cities. Series: ESRI Data & Maps. Redlands, CA, USA: Environmental Systems Research Institute, Inc. (ESRI). Available at http://webgis.wr.usgs.gov/globalgis/. 01 February 2001. Background: Includes only the world's major cities.
geographic features: water bodies (geographic_features_sea)
Labels for locations (gazetteer) of major bodies of water in the Southern Hemisphere, including oceans, seas, and Drake Passage.
geographic features: ice (geographic_features_ice)
Labels for locations (gazetteer) of major ice-related features in the Southern Hemisphere, including glaciers, ice caps, and ice shelves.
geographic features: land (geographic_features_land)
Labels for locations (gazetteer) of major land-related features in the Southern Hemisphere, including mountain ranges and Antarctic regions.
Antarctic permanent research stations (antarctic_research_stations)
Wikipedia contributors. 24 January 2007. List of research stations in Antarctica. Wikipedia, The Free Encyclopedia. Available at http://en.wikipedia.org/wiki/List_of_research_stations_in_Antarctica. 24 January 2007. Background: A number of governments maintain permanent research stations throughout Antarctica. Many of the stations are staffed around the year. A total of 30 countries (as of October 2006), all signatory to the Antarctic Treaty, operate seasonal (summer) and year-round research stations on the continent and in its surrounding oceans. The population of persons doing and supporting science on the continent and its nearby islands varies from approximately 4,000 persons during the summer season to 1,000 persons during winter.
Antarctic ice core locations (antarctic_ice_cores)
Maurer, J. compiler. 2009. Deep ice core locations. Boulder, Colorado USA: National Snow and Ice Data Center. Digital media. Accessed 03 May 2009. Background: Labels the locations of several deep ice cores from the Antarctic ice sheet, including: the European Project for Ice Coring in Antarctica (EPICA) Dome C; Siple Dome, West Antarctic Ice Sheet (WAIS) Dome A; Vostok; WAIS Divide; Byrd; Taylor Dome; Dome Fuji; Dome B; Komsomolskaya; and Talos Dome Ice Core (TALDICE).
South Poles (south_poles)
Labels the location of various types of South Poles: geographic, geomagnetic, magnetic, pole of cold, and pole of inaccessibility.
South Pole, Geographic (south_pole_geographic)
Labels the location of the South Pole (90 deg S, 0 deg), also referred to as the Geographic South Pole.
South Pole, Magnetic (south_pole_magnetic)
McClean, S. 24 January 2007. Geomagnetism Frequently Asked Questions. National Geophysical Data Center. http://www.ngdc.noaa.gov/seg/geomag/faqgeom.shtml#q4b. 24 January 2007. Background: Labels the location of the Magnetic South Pole, which in 2005 was computed to be 64.53 deg S, 137.86 deg E by the World Magnetic Model (WMM). The Earth's magnetic poles are the two points on the earth's surface at which magnetic meridians converge; the horizontal component of the magnetic field of the earth becomes zero at this point; also called the dip pole. The magnetic poles migrate over time.
South Pole, Geomagnetic (south_pole_geomagnetic)
McClean, S. 24 January 2007. Geomagnetism Frequently Asked Questions. National Geophysical Data Center. http://www.ngdc.noaa.gov/seg/geomag/faqgeom.shtml#q4b. 24 January 2007. Background: Labels the location of the Geomagnetic South Pole, which in 2005 was computed to be 79.74 deg S, 108.22 deg E by the World Magnetic Model (WMM). The Earth's geomagnetic poles are the points of intersection of the Earth's surface with the axis of a simple magnetic dipole that best approximates the Earth's actual, more complex magnetic field. If the Earth's magnetic field were a perfect dipole, then the field lines would be vertical at the geomagnetic poles and they would therefore coincide with the magnetic poles: however, the dipole approximation is in fact far from perfect, so in reality the magnetic and geomagnetic poles lie some distance apart. The geomagnetic poles migrate over time.
South Pole of Inaccessibility (south_pole_inaccessibility)
Wikipedia contributors. 20 January 2007. South Pole. Wikipedia, The Free Encyclopedia. Available at http://en.wikipedia.org/w/index.php?title=South_Pole&oldid=101993204. 24 January 2007. Background: Labels the location of the South Pole of Inaccessibility (85.83 deg S, 65.78 deg E), which is the point on the Antarctic continent farthest from the Southern Ocean. This pole was reached on December 14, 1958 by the 3rd Soviet Antarctic Expedition, led by Yevgeny Tolstikov. At that point they established a temporary station named Polyus Nedostupnosti.
South Pole of Cold (south_pole_of_cold)
Wikipedia contributors. 23 January 2007. Pole of Cold. Wikipedia, The Free Encyclopedia. Available at http://en.wikipedia.org/w/index.php?title=Pole_of_Cold&oldid=102629381. 24 January 2007. Background: The Poles of Cold are the places in the Northern and Southern hemispheres where the lowest air temperature was recorded. In the Southern hemisphere, the Pole of Cold is in Antarctica near the Russian Antarctic station Vostok at 78.47°S, 106.8°E where a temperature of -89.2°C (-129.8°F) was recorded on July 21, 1983.
South Poles (south_poles_wfs)
Labels the location of various types of South Poles: geographic, geomagnetic, magnetic, pole of cold, and pole of inaccessibility. Citations: McClean, S. 2007. Geomagnetism frequently asked questions. Boulder, Colorado USA: National Geophysical Data Center (NGDC). Available at http://www.ngdc.noaa.gov/geomag/faqgeom.shtml. Accessed 24 January 2007; Wikipedia contributors. 2007. Pole of Cold. Wikipedia, The Free Encyclopedia. Available at http://en.wikipedia.org/wiki/Pole_of_Cold. Accessed 24 January 2007; Wikipedia contributors. 2007. South Pole. Wikipedia, The Free Encyclopedia. Available at http://en.wikipedia.org/w/index.php?title=South_Pole&oldid=101993204. Accessed 24 Janu ary 2007.
copyright (copyright)
Provides the text 'National Snow and Ice Data Center' to the lower-left-hand portion of the map to help identify NSIDC as the source of the Atlas of the Cryosphere map server. All maps, data, and information contained in the Atlas of the Cryosphere are public domain unless specifically stated otherwise. Proper citation and acknowledgement is requested: an example citation for each data source is provided at 'http://nsidc.org/data/atlas/cryosphere_atlas_south_info.html'.
There are currently no notifications for the service, click the feed icon to subscribe.