EEA |
|
EPRTR Diffuse Emissions to Air

| Service health Now: |
|---|
- Interface
- Web Service, OGC Web Map Service 1.3.0
- Keywords
- ["Pollution","Air","EPRTR","Europe","NOx","SO2","PM10","CO","CO2","NH3"]
- Fees
- unknown
- Access constraints
- unknown
- Supported languages
- No INSPIRE Extended Capabilities (including service language support) given. See INSPIRE Technical Guidance - View Services for more information.
- Data provider
-
EEA (unverified)
Contact information:
EEA
- Service metadata
- No INSPIRE Extended Capabilities (including service metadata) given. See INSPIRE Technical Guidance - View Services for more information.
Ads by Google
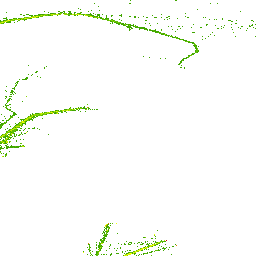
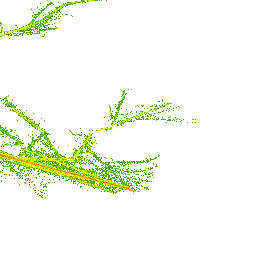
The map shows emissions to air from the EU27 and EFTA4 countries per 5x5 km2 grid cell for the year 2008, where this information was available in 2010. The emissions are expressed in tonnes per grid cell.The Diffuse Emissions are spread across the following groups:Industrial releases (5 layers): NOx, SO2, PM10, CO and CO2Non-industrial combustion (5 layers): NOx, SO2, PM10, CO and CO2Road transport (5 layers): NOx, SO2, PM10, CO and CO2Domestic shipping (5 layers): NOx, SO2, PM10, CO and CO2Domestic aviation (5 layers): NOx, SO2, PM10, CO and CO2International aviation (5 layers): NOx, SO2, PM10, CO and CO2Agriculture (2 layers): NH3, PM10Data source: http://www.eea.europa.eu/data-and-maps/data/european-pollutant-release-and-transfer-register-e-prtr-regulation-art-8-diffuse-air-data
Available map layers (32)
CO2 emissions from international shipping, [kt/grid] (0)
The map shows the diffuse emissions of carbon dioxide (CO2) to air from international shipping of the EU27 and EFTA4 countries per 5x5 km2 grid cell for the year 2008, where this information was available in 2010. The diffuse emissions of carbon dioxide (CO2) are expressed in tonnes per grid cell.
CO emissions from international shipping, [t/grid] (1)
The map shows the diffuse emissions of carbon monoxide (CO) to air from international shipping of the EU27 and EFTA4 countries per 5x5 km2 grid cell for the year 2008, where this information was available in 2010. The diffuse emissions of carbon monoxide (CO) are expressed in tonnes per grid cell.
PM10 emissions from international shipping, [t/grid] (2)
The map shows the diffuse emissions of particulate matter (PM10) to air from international shipping of the EU27 and EFTA4 countries per 5x5 km2 grid cell for the year 2008, where this information was available in 2010. The diffuse emissions of particulate matter (PM10) are expressed in tonnes per grid cell.
SO2 emissions from international shipping, [t/grid] (3)
The map shows the diffuse emissions of sulphur dioxide (SO2) to air from international shipping of the EU27 and EFTA4 countries per 5x5 km2 grid cell for the year 2008, where this information was available in 2010. The diffuse emissions of sulphur dioxide (SO2) are expressed in tonnes per grid cell.
NOX emissions from international shipping, [t/grid] (4)
The map shows the diffuse emissions of nitrogen oxide (NOX) to air from international shipping of the EU27 and EFTA4 countries per 5x5 km2 grid cell for the year 2008, where this information was available in 2010. The diffuse emissions of nitrogen oxides (NOX) are expressed in tonnes per grid cell.
CO2 emissions from domestic aviation, [kt/grid] (5)
CO2 emissions from domestic shipping, [kt/grid] (6)
The map shows the diffuse emissions of carbon dioxide (CO2) to air from domestic shipping of the EU27 and EFTA4 countries per 5x5 km2 grid cell for the year 2008, where this information was available in 2010. The diffuse emissions of carbon dioxide (CO2) are expressed in tonnes per grid cell.
CO2 emissions from road transport, [kt/grid] (7)
The map shows the diffuse emissions of carbon dioxide (CO2) to air from road transport of the EU27 and EFTA4 countries per 5x5 km2 grid cell for the year 2008, where this information was available in 2010. The diffuse emissions of carbon dioxide (CO2) are expressed in tonnes per grid cell.
CO2 emissions from non-industrial combustion, [kt/grid] (8)
The map shows carbon dioxide (CO2) emissions to air from non-industrial combustion plants of the EU27 and EFTA4 countries per 5x5 km2 grid cell for the year 2008, where this information was available in 2010. The diffuse emissions of carbon dioxide (CO2) are expressed in tonnes per grid cell.
CO2 emissions from diffuse industrial releases, [kt/grid] (9)
CO emissions from domestic aviation, [t/grid] (10)
The map shows the diffuse emissions of carbon monoxide (CO) to air from domestic aviation (below an altitude of 1000m) of the EU27 and EFTA4 countries per 5x5 km2 grid cell for the year 2008, where this information was available in 2010. The diffuse emissions of Carbon monoxide (CO) are expressed in tonnes per grid cell.
CO emissions from domestic shipping, [t/grid] (11)
The map shows the diffuse emissions of carbon monoxide (CO) to air from domestic shipping of the EU27 and EFTA4 countries per 5x5 km2 grid cell for the year 2008, where this information was available in 2010. The diffuse emissions of carbon monoxide (CO) are expressed in tonnes per grid cell.
CO emissions from road transport, [t/grid] (12)
The map shows the diffuse emissions of carbon monoxide (CO) to air from road transport of the EU27 and EFTA4 countries per 5x5 km2 grid cell for the year 2008, where this information was available in 2010. The diffuse emissions of carbon monoxide (CO) are expressed in tonnes per grid cell.
CO emissions from non-industrial combustion, [t/grid] (13)
The map shows the carbon monoxide (CO) emissions to air from non-industrial combustion plants of the EU27 and EFTA4 countries per 5x5 km2 grid cell for the year 2008, where this information was available in 2010. The diffuse emissions of carbon monoxide (CO) are expressed in tonnes per grid cell.
CO emissions from diffuse industrial releases, [t/grid] (14)
The map shows the of carbon monoxide (CO) emissions to air from diffuse industrial releases of the EU27 and EFTA4 countries per 5x5 km2 grid cell for the year 2008, where this information was available in 2010. The diffuse emissions of carbon monoxide (CO) are expressed in tonnes per grid cell.
NH3 emissions from agriculture, [t/grid] (15)
PM10 emissions from agriculture, [t/grid] (16)
PM10 emissions from domestic aviation, [t/grid] (17)
The map shows the diffuse emissions of particulate matter (PM10) to air from domestic aviation (below an altitude of 1000m) of the EU27 and EFTA4 countries per 5x5 km2 grid cell for the year 2008, where this information was available in 2010. The diffuse emissions of Particulate matter (PM10) are expressed in tonnes per grid cell.
PM10 emissions from domestic shipping, [t/grid] (18)
The map shows the diffuse emissions of particulate matter (PM10) to air from domestic shipping of the EU27 and EFTA4 countries per 5x5 km2 grid cell for the year 2008, where this information was available in 2010. The diffuse emissions of particulate matter (PM10) are expressed in tonnes per grid cell.
PM10 emissions from road transport, [t/grid] (19)
The map shows the diffuse emissions of particulate matter (PM10) to air from road transport of the EU27 and EFTA4 countries per 5x5 km2 grid cell for the year 2008, where this information was available in 2010. The diffuse emissions of particulate matter (PM10) are expressed in tonnes per grid cell.
PM10 emissions from non-industrial combustion, [t/grid] (20)
The map shows the particulate matter (PM10) emissions to air in 2008 from non-industrial combustion plants of the EU27 and EFTA4 countries per 5x5 km2 grid cell for the year 2008, where this information was available in 2010. The diffuse emissions of particulate matter (PM10) are expressed in tonnes per grid cell.
PM10 emissions from diffuse industrial releases, [t/grid] (21)
The map shows the particulate matter (PM10) emissions to air from diffuse industrial releases of the EU27 and EFTA4 countries per 5x5 km2 grid cell for the year 2008, where this information was available in 2010. The diffuse emissions of particulate matter (PM10) are expressed in tonnes per grid cell.
SO2 emissions from domestic aviation, [t/grid] (22)
The map shows the diffuse emissions of sulphur dioxide (SO2) to air from domestic aviation (below an altitude of 1000m) of the EU27 and EFTA countries in 2008 in a 5 x 5 km² grid resolution, where this information was available in 2010. The diffuse emissions of Sulphur dioxide (SO2) are expressed in tonnes per grid cell.
SO2 emissions from domestic shipping, [t/grid] (23)
The map shows the diffuse emissions of sulphur dioxide (SO2) to air from domestic shipping of the EU27 and EFTA4 countries per 5x5 km2 grid cell for the year 2008, where this information was available in 2010. The diffuse emissions of sulphur dioxide (SO2) are expressed in tonnes per grid cell.
SO2 emissions from road transport, [t/grid] (24)
The map shows the diffuse emissions of sulphur dioxide (SO2) to air from road transport of the EU27 and EFTA4 countries per 5x5 km2 grid cell for the year 2008, where this information was available in 2010. The diffuse emissions of sulphur dioxide (SO2) are expressed in tonnes per grid cell.
SO2 emissions from non-industrial combustion, [t/grid] (25)
The map shows the sulphur dioxide (SO2) emissions to air from non-industrial combustion plants of the EU27 and EFTA4 countries per 5x5 km2 grid cell for the year 2008, where this information was available in 2010. The diffuse emissions of sulphur dioxide (SO2) are expressed in tonnes per grid cell.
SO2 emissions from diffuse industrial releases, [t/grid] (26)
The map shows the sulphur dioxide (SO2) emissions to air from diffuse industrial releases of the EU27 and EFTA4 countries per 5x5 km2 grid cell for the year 2008, where this information was available in 2010. The diffuse emissions of sulphur dioxide (SO2) are expressed in tonnes per grid cell.
NOX emissions from domestic aviation, [t/grid] (27)
The map shows the diffuse emissions of nitrogen oxides (NOX) to air from domestic aviation (below an altitude of 1000m) of the EU27 and EFTA4 countries per 5x5 km2 grid cell for the year 2008, where this information was available in 2010. The diffuse emissions of nitrogen oxides (NOX) are expressed in tonnes per grid cell.
NOX emissions from domestic shipping, [t/grid] (28)
The map shows the diffuse emissions of nitrogen oxide (NOX) to air from domestic shipping of the EU27 and EFTA4 countries per 5x5 km2 grid cell for the year 2008, where this information was available in 2010. The diffuse emissions of nitrogen oxides (NOX) are expressed in tonnes per grid cell.
NOX emissions from road transport, [t/grid] (29)
The map shows the diffuse emissions of nitrogen oxides (NOX) to air from road transport of the EU27 and EFTA4 countries per 5x5 km2 grid cell for the year 2008, where this information was available in 2010. The diffuse emissions of nitrogen oxides (NOX) are expressed in tonnes per grid cell.
NOX emissions from non-industrial combustion, [t/grid] (30)
The map shows the nitrogen oxides (NOX) emissions to air from non-industrial combustion plants of the EU27 and EFTA4 countries per 5x5 km2 grid cell for the year 2008, where this information was available in 2010. The diffuse emissions of nitrogen oxides (NOX) are expressed in tonnes per grid cell.
NOX emissions from diffuse industrial releases, [t/grid] (31)
The map shows the nitrogen oxides (NOX) emissions to air from diffuse industrial releases of the EU27 and EFTA4 countries per 5x5 km2 grid cell for the year 2008, where this information was available in 2010. The diffuse emissions of nitrogen oxides (NOX) are expressed in tonnes per grid cell.
There are currently no notifications for the service, click the feed icon to subscribe.