Lautenschlager et al., 2009. World Dat… |
|
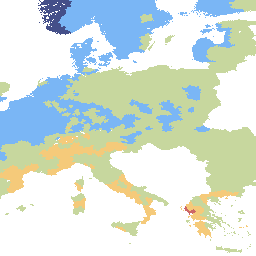
Change in annual mean num days with extreme precip(>20mm/day) between CCLM scen (2071-2100) and ref run (1961-1990) for IPCC scen A1B


| Service health Now: |
|---|
- Interface
- Web Service, OGC Web Map Service 1.3.0
- Keywords
- Extreme Rain,Climate Change
- Fees
- unknown
- Access constraints
- unknown
- Supported languages
- No INSPIRE Extended Capabilities (including service language support) given. See INSPIRE Technical Guidance - View Services for more information.
- Data provider
-
Lautenschlager et al., 2009. World Data Center for Climate (unverified)
Contact information:
Lautenschlager et al., 2009. World Data Center for Climate
- Service metadata
- No INSPIRE Extended Capabilities (including service metadata) given. See INSPIRE Technical Guidance - View Services for more information.
Ads by Google
Map presents changes in annual mean number of days with extreme precipitation (> 20 mm/day) between 20712100 and 19611990 period, based on CCLM regional climate model, using IPCC scenario A1B. Lautenschlager et al., 2009 Lautenschlager, M., Keuler, K., Wunram, C., Keup Thiel, E., Schubert, M., Will, A., Rockel, B. and Boehm, U., 2009, Climate Simulation with CLM, Climate of the 20th Century (run no.1, 2 and 3) and Scenarios A1B and B1 (run no.1 and 2), Data Stream 3: European region MPI-M/MaD. World Data Center for Climate.
Available map layers (1)
Change in annual mean number of days with extreme precipitation (> 20 mm/day) for 2071-2100 (0)
Map presents changes in annual mean number of days with extreme precipitation (> 20 mm/day) between 20712100 and 19611990 period, based on CCLM regional climate model, using IPCC scenario A1B. Lautenschlager et al., 2009 Lautenschlager, M., Keuler, K., Wunram, C., Keup Thiel, E., Schubert, M., Will, A., Rockel, B. and Boehm, U., 2009, Climate Simulation with CLM, Climate of the 20th Century (run no.1, 2 and 3) and Scenarios A1B and B1 (run no.1 and 2), Data Stream 3: European region MPI-M/MaD. World Data Center for Climate.
There are currently no notifications for the service, click the feed icon to subscribe.