National Snow and Ice Data Center |
|
Antarctic Cryosphere Access Portal (A-CAP)

| Service health Now: |
|---|
- Interface
- Web Service, OGC Web Map Service 1.1.1
- Keywords
- Antarctica, Cryosphere, Earth Science, Glaciers, Ice Extent, Ice Sheets, Oceans, Polar, Sea Ice, Sea Ice Concentration, Snow/Ice, Snow Cover, Snow Water Equivalent, Southern Hemisphere
- Fees
- none
- Access constraints
- none
- Data provider
-
National Snow and Ice Data Center (unverified)
Contact information:
NSIDC User Services
National Snow and Ice Data Center
mailing:
CIRES, 449 UCB, University of Colorado, 80309-0449 Boulder, USAEmail:
Phone: +1 303.492.6199
Ads by Google
The National Snow and Ice Data Center (NSIDC) Antarctic Cryosphere Access Portal (A-CAP) is a map server that provides data and information pertinent to the frozen regions of the Antarctic ice sheet and the Southern Ocean, including monthly climatologies of sea ice extent and concentration, ice sheet elevation and accumulation, satellite imagery, and more. In addition to providing map images and source data through Open Geospatial Consortium, Inc. (OGC) protocols--Web Map Service (WMS), Web Feature Service (WFS), and Web Coverage Service (WCS)--a dynamic Web interface for exploring these data is also available at http://nsidc.org/agdc/acap/. If you have questions, comments or suggestions, please contact NSIDC User Services at +1.303.492.6199 or nsidc@nsidc.org.
Available map layers (349)
Antarctic Cryosphere Access Portal (A-CAP) (acap)
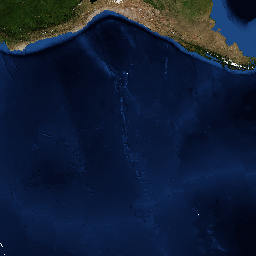
satellite imagery, January (2004) (blue_marble_01)
Stockli, R, Vermote, E., Saleous, N., Simmon R., and D. Herring. 2005. The Blue Marble Next Generation - A true color earth dataset including seasonal dynamics from MODIS. Greenbelt, Maryland USA: NASA Earth Observatory. Digital media. Available at ftp://sidads.colorado.edu/pub/DATASETS/BM/ and http://visibleearth.nasa.gov/view_set.php?categoryID=2355. Accessed 12 September 2007. Background: Cloud-free satellite image mosaic at 500-meter resolution compiled from NASA's Moderate-Resolution Imaging Spectroradiometer (MODIS) spaceborne remote sensing instrument for the month of January in 2004. Included in this data set is topographic and bathymetric relief shading from the Shuttle Radar Topography Mission (SRTM), GTOPO30, Radarsat Antarctic Mapping Project (RAMP) Digital Elevation Model (DEM) Version 2, and the General Bathymetric Chart of the Oceans (GEBCO).
satellite imagery, January (2004) (blue_marble_01_circle)
Stockli, R, Vermote, E., Saleous, N., Simmon R., and D. Herring. 2005. The Blue Marble Next Generation - A true color earth dataset including seasonal dynamics from MODIS. Greenbelt, Maryland USA: NASA Earth Observatory. Digital media. Available at ftp://sidads.colorado.edu/pub/DATASETS/BM/ and http://visibleearth.nasa.gov/view_set.php?categoryID=2355. Accessed 12 September 2007. Background: Cloud-free satellite image mosaic at 500-meter resolution compiled from NASA's Moderate-Resolution Imaging Spectroradiometer (MODIS) spaceborne remote sensing instrument for the month of January in 2004. Included in this data set is topographic and bathymetric relief shading from the Shuttle Radar Topography Mission (SRTM), GTOPO30, Radarsat Antarctic Mapping Project (RAMP) Digital Elevation Model (DEM) Version 2, and the General Bathymetric Chart of the Oceans (GEBCO). This layer only shows the imagery from the Southern Hemisphere, which has the appearance of a circle in a polar projection.
satellite imagery, July (2004) (blue_marble_07)
Stockli, R, Vermote, E., Saleous, N., Simmon R., and D. Herring. 2005. The Blue Marble Next Generation - A true color earth dataset including seasonal dynamics from MODIS. Greenbelt, Maryland USA: NASA Earth Observatory. Digital media. Available at ftp://sidads.colorado.edu/pub/DATASETS/BM/ and http://visibleearth.nasa.gov/view_set.php?categoryID=2355. Accessed 12 September 2007. Background: Cloud-free satellite image mosaic at 500-meter resolution compiled from NASA's Moderate-Resolution Imaging Spectroradiometer (MODIS) spaceborne remote sensing instrument for the month of July in 2004. Included in this data set is topographic and bathymetric relief shading from the Shuttle Radar Topography Mission (SRTM), GTOPO30, Radarsat Antarctic Mapping Project (RAMP) Digital Elevation Model (DEM) Version 2, and the General Bathymetric Chart of the Oceans (GEBCO).
satellite imagery, July (2004) (blue_marble_07_circle)
Stockli, R, Vermote, E., Saleous, N., Simmon R., and D. Herring. 2005. The Blue Marble Next Generation - A true color earth dataset including seasonal dynamics from MODIS. Greenbelt, Maryland USA: NASA Earth Observatory. Digital media. Available at ftp://sidads.colorado.edu/pub/DATASETS/BM/ and http://visibleearth.nasa.gov/view_set.php?categoryID=2355. Accessed 12 September 2007. Background: Cloud-free satellite image mosaic at 500-meter resolution compiled from NASA's Moderate-Resolution Imaging Spectroradiometer (MODIS) spaceborne remote sensing instrument for the month of July in 2004. Included in this data set is topographic and bathymetric relief shading from the Shuttle Radar Topography Mission (SRTM), GTOPO30, Radarsat Antarctic Mapping Project (RAMP) Digital Elevation Model (DEM) Version 2, and the General Bathymetric Chart of the Oceans (GEBCO). This layer only shows the imagery from the Southern Hemisphere, which has the appearance of a circle in a polar projection.
sea ice extent, January (1979-2007) (sea_ice_extent_01)
Stroeve, J. and W. Meier. 1999, updated 2008. Sea Ice Trends and Climatologies from SMMR and SSM/I. Boulder, Colorado USA: National Snow and Ice Data Center. Digital media. Available at http://nsidc.org/data/smmr_ssmi_ancillary/monthly_means.html. Accessed 27 June 2008. Compiled from: Cavalieri, D., C. Parkinson, P. Gloersen, and H. J. Zwally. 1996. Sea ice concentrations from Nimbus-7 SMMR and DMSP SSM/I passive microwave data. Boulder, Colorado USA: National Snow and Ice Data Center. Digital media. Available at http://nsidc.org/data/nsidc-0051.html. Background: Sea ice extent includes all areas where sea ice concentration is greater than or equal to 15%. Monthly climatologies of sea ice concentration represent mean ice concentration percentages for each month over the entire time period 1979-2007, which is generated from passive microwave brightness temperature data derived from Nimbus-7 Scanning Multichannel Microwave Radiometer (SMMR) and Defense Meteorological Satellite Program (DMSP) -F8, -F11 and -F13 Special Sensor Microwave/Imager (SSM/I) radiances at a grid cell size of 25 x 25 km using the NASA Team algorithm developed by the Oceans and Ice Branch, Laboratory for Hydrospheric Processes at NASA Goddard Space Flight Center (GSFC).
sea ice extent, February (1979-2007) (sea_ice_extent_02)
Stroeve, J. and W. Meier. 1999, updated 2008. Sea Ice Trends and Climatologies from SMMR and SSM/I. Boulder, Colorado USA: National Snow and Ice Data Center. Digital media. Available at http://nsidc.org/data/smmr_ssmi_ancillary/monthly_means.html. Accessed 27 June 2008. Compiled from: Cavalieri, D., C. Parkinson, P. Gloersen, and H. J. Zwally. 1996. Sea ice concentrations from Nimbus-7 SMMR and DMSP SSM/I passive microwave data. Boulder, Colorado USA: National Snow and Ice Data Center. Digital media. Available at http://nsidc.org/data/nsidc-0051.html. Background: Sea ice extent includes all areas where sea ice concentration is greater than or equal to 15%. Monthly climatologies of sea ice concentration represent mean ice concentration percentages for each month over the entire time period 1979-2007, which is generated from passive microwave brightness temperature data derived from Nimbus-7 Scanning Multichannel Microwave Radiometer (SMMR) and Defense Meteorological Satellite Program (DMSP) -F8, -F11 and -F13 Special Sensor Microwave/Imager (SSM/I) radiances at a grid cell size of 25 x 25 km using the NASA Team algorithm developed by the Oceans and Ice Branch, Laboratory for Hydrospheric Processes at NASA Goddard Space Flight Center (GSFC).
sea ice extent, March (1979-2007) (sea_ice_extent_03)
Stroeve, J. and W. Meier. 1999, updated 2008. Sea Ice Trends and Climatologies from SMMR and SSM/I. Boulder, Colorado USA: National Snow and Ice Data Center. Digital media. Available at http://nsidc.org/data/smmr_ssmi_ancillary/monthly_means.html. Accessed 27 June 2008. Compiled from: Cavalieri, D., C. Parkinson, P. Gloersen, and H. J. Zwally. 1996. Sea ice concentrations from Nimbus-7 SMMR and DMSP SSM/I passive microwave data. Boulder, Colorado USA: National Snow and Ice Data Center. Digital media. Available at http://nsidc.org/data/nsidc-0051.html. Background: Sea ice extent includes all areas where sea ice concentration is greater than or equal to 15%. Monthly climatologies of sea ice concentration represent mean ice concentration percentages for each month over the entire time period 1979-2007, which is generated from passive microwave brightness temperature data derived from Nimbus-7 Scanning Multichannel Microwave Radiometer (SMMR) and Defense Meteorological Satellite Program (DMSP) -F8, -F11 and -F13 Special Sensor Microwave/Imager (SSM/I) radiances at a grid cell size of 25 x 25 km using the NASA Team algorithm developed by the Oceans and Ice Branch, Laboratory for Hydrospheric Processes at NASA Goddard Space Flight Center (GSFC).
sea ice extent, April (1979-2007) (sea_ice_extent_04)
Stroeve, J. and W. Meier. 1999, updated 2008. Sea Ice Trends and Climatologies from SMMR and SSM/I. Boulder, Colorado USA: National Snow and Ice Data Center. Digital media. Available at http://nsidc.org/data/smmr_ssmi_ancillary/monthly_means.html. Accessed 27 June 2008. Compiled from: Cavalieri, D., C. Parkinson, P. Gloersen, and H. J. Zwally. 1996. Sea ice concentrations from Nimbus-7 SMMR and DMSP SSM/I passive microwave data. Boulder, Colorado USA: National Snow and Ice Data Center. Digital media. Available at http://nsidc.org/data/nsidc-0051.html. Background: Sea ice extent includes all areas where sea ice concentration is greater than or equal to 15%. Monthly climatologies of sea ice concentration represent mean ice concentration percentages for each month over the entire time period 1979-2007, which is generated from passive microwave brightness temperature data derived from Nimbus-7 Scanning Multichannel Microwave Radiometer (SMMR) and Defense Meteorological Satellite Program (DMSP) -F8, -F11 and -F13 Special Sensor Microwave/Imager (SSM/I) radiances at a grid cell size of 25 x 25 km using the NASA Team algorithm developed by the Oceans and Ice Branch, Laboratory for Hydrospheric Processes at NASA Goddard Space Flight Center (GSFC).
sea ice extent, May (1979-2007) (sea_ice_extent_05)
Stroeve, J. and W. Meier. 1999, updated 2008. Sea Ice Trends and Climatologies from SMMR and SSM/I. Boulder, Colorado USA: National Snow and Ice Data Center. Digital media. Available at http://nsidc.org/data/smmr_ssmi_ancillary/monthly_means.html. Accessed 27 June 2008. Compiled from: Cavalieri, D., C. Parkinson, P. Gloersen, and H. J. Zwally. 1996. Sea ice concentrations from Nimbus-7 SMMR and DMSP SSM/I passive microwave data. Boulder, Colorado USA: National Snow and Ice Data Center. Digital media. Available at http://nsidc.org/data/nsidc-0051.html. Background: Sea ice extent includes all areas where sea ice concentration is greater than or equal to 15%. Monthly climatologies of sea ice concentration represent mean ice concentration percentages for each month over the entire time period 1979-2007, which is generated from passive microwave brightness temperature data derived from Nimbus-7 Scanning Multichannel Microwave Radiometer (SMMR) and Defense Meteorological Satellite Program (DMSP) -F8, -F11 and -F13 Special Sensor Microwave/Imager (SSM/I) radiances at a grid cell size of 25 x 25 km using the NASA Team algorithm developed by the Oceans and Ice Branch, Laboratory for Hydrospheric Processes at NASA Goddard Space Flight Center (GSFC).
sea ice extent, June (1979-2007) (sea_ice_extent_06)
Stroeve, J. and W. Meier. 1999, updated 2008. Sea Ice Trends and Climatologies from SMMR and SSM/I. Boulder, Colorado USA: National Snow and Ice Data Center. Digital media. Available at http://nsidc.org/data/smmr_ssmi_ancillary/monthly_means.html. Accessed 27 June 2008. Compiled from: Cavalieri, D., C. Parkinson, P. Gloersen, and H. J. Zwally. 1996. Sea ice concentrations from Nimbus-7 SMMR and DMSP SSM/I passive microwave data. Boulder, Colorado USA: National Snow and Ice Data Center. Digital media. Available at http://nsidc.org/data/nsidc-0051.html. Background: Sea ice extent includes all areas where sea ice concentration is greater than or equal to 15%. Monthly climatologies of sea ice concentration represent mean ice concentration percentages for each month over the entire time period 1979-2007, which is generated from passive microwave brightness temperature data derived from Nimbus-7 Scanning Multichannel Microwave Radiometer (SMMR) and Defense Meteorological Satellite Program (DMSP) -F8, -F11 and -F13 Special Sensor Microwave/Imager (SSM/I) radiances at a grid cell size of 25 x 25 km using the NASA Team algorithm developed by the Oceans and Ice Branch, Laboratory for Hydrospheric Processes at NASA Goddard Space Flight Center (GSFC).
sea ice extent, July (1979-2007) (sea_ice_extent_07)
Stroeve, J. and W. Meier. 1999, updated 2008. Sea Ice Trends and Climatologies from SMMR and SSM/I. Boulder, Colorado USA: National Snow and Ice Data Center. Digital media. Available at http://nsidc.org/data/smmr_ssmi_ancillary/monthly_means.html. Accessed 27 June 2008. Compiled from: Cavalieri, D., C. Parkinson, P. Gloersen, and H. J. Zwally. 1996. Sea ice concentrations from Nimbus-7 SMMR and DMSP SSM/I passive microwave data. Boulder, Colorado USA: National Snow and Ice Data Center. Digital media. Available at http://nsidc.org/data/nsidc-0051.html. Background: Sea ice extent includes all areas where sea ice concentration is greater than or equal to 15%. Monthly climatologies of sea ice concentration represent mean ice concentration percentages for each month over the entire time period 1979-2007, which is generated from passive microwave brightness temperature data derived from Nimbus-7 Scanning Multichannel Microwave Radiometer (SMMR) and Defense Meteorological Satellite Program (DMSP) -F8, -F11 and -F13 Special Sensor Microwave/Imager (SSM/I) radiances at a grid cell size of 25 x 25 km using the NASA Team algorithm developed by the Oceans and Ice Branch, Laboratory for Hydrospheric Processes at NASA Goddard Space Flight Center (GSFC).
sea ice extent, August (1979-2007) (sea_ice_extent_08)
Stroeve, J. and W. Meier. 1999, updated 2008. Sea Ice Trends and Climatologies from SMMR and SSM/I. Boulder, Colorado USA: National Snow and Ice Data Center. Digital media. Available at http://nsidc.org/data/smmr_ssmi_ancillary/monthly_means.html. Accessed 27 June 2008. Compiled from: Cavalieri, D., C. Parkinson, P. Gloersen, and H. J. Zwally. 1996. Sea ice concentrations from Nimbus-7 SMMR and DMSP SSM/I passive microwave data. Boulder, Colorado USA: National Snow and Ice Data Center. Digital media. Available at http://nsidc.org/data/nsidc-0051.html. Background: Sea ice extent includes all areas where sea ice concentration is greater than or equal to 15%. Monthly climatologies of sea ice concentration represent mean ice concentration percentages for each month over the entire time period 1979-2007, which is generated from passive microwave brightness temperature data derived from Nimbus-7 Scanning Multichannel Microwave Radiometer (SMMR) and Defense Meteorological Satellite Program (DMSP) -F8, -F11 and -F13 Special Sensor Microwave/Imager (SSM/I) radiances at a grid cell size of 25 x 25 km using the NASA Team algorithm developed by the Oceans and Ice Branch, Laboratory for Hydrospheric Processes at NASA Goddard Space Flight Center (GSFC).
sea ice extent, September (1979-2007) (sea_ice_extent_09)
Stroeve, J. and W. Meier. 1999, updated 2008. Sea Ice Trends and Climatologies from SMMR and SSM/I. Boulder, Colorado USA: National Snow and Ice Data Center. Digital media. Available at http://nsidc.org/data/smmr_ssmi_ancillary/monthly_means.html. Accessed 27 June 2008. Compiled from: Cavalieri, D., C. Parkinson, P. Gloersen, and H. J. Zwally. 1996. Sea ice concentrations from Nimbus-7 SMMR and DMSP SSM/I passive microwave data. Boulder, Colorado USA: National Snow and Ice Data Center. Digital media. Available at http://nsidc.org/data/nsidc-0051.html. Background: Sea ice extent includes all areas where sea ice concentration is greater than or equal to 15%. Monthly climatologies of sea ice concentration represent mean ice concentration percentages for each month over the entire time period 1979-2007, which is generated from passive microwave brightness temperature data derived from Nimbus-7 Scanning Multichannel Microwave Radiometer (SMMR) and Defense Meteorological Satellite Program (DMSP) -F8, -F11 and -F13 Special Sensor Microwave/Imager (SSM/I) radiances at a grid cell size of 25 x 25 km using the NASA Team algorithm developed by the Oceans and Ice Branch, Laboratory for Hydrospheric Processes at NASA Goddard Space Flight Center (GSFC).
sea ice extent, October (1979-2007) (sea_ice_extent_10)
Stroeve, J. and W. Meier. 1999, updated 2008. Sea Ice Trends and Climatologies from SMMR and SSM/I. Boulder, Colorado USA: National Snow and Ice Data Center. Digital media. Available at http://nsidc.org/data/smmr_ssmi_ancillary/monthly_means.html. Accessed 27 June 2008. Compiled from: Cavalieri, D., C. Parkinson, P. Gloersen, and H. J. Zwally. 1996. Sea ice concentrations from Nimbus-7 SMMR and DMSP SSM/I passive microwave data. Boulder, Colorado USA: National Snow and Ice Data Center. Digital media. Available at http://nsidc.org/data/nsidc-0051.html. Background: Sea ice extent includes all areas where sea ice concentration is greater than or equal to 15%. Monthly climatologies of sea ice concentration represent mean ice concentration percentages for each month over the entire time period 1979-2007, which is generated from passive microwave brightness temperature data derived from Nimbus-7 Scanning Multichannel Microwave Radiometer (SMMR) and Defense Meteorological Satellite Program (DMSP) -F8, -F11 and -F13 Special Sensor Microwave/Imager (SSM/I) radiances at a grid cell size of 25 x 25 km using the NASA Team algorithm developed by the Oceans and Ice Branch, Laboratory for Hydrospheric Processes at NASA Goddard Space Flight Center (GSFC).
sea ice extent, November (1979-2007) (sea_ice_extent_11)
Stroeve, J. and W. Meier. 1999, updated 2008. Sea Ice Trends and Climatologies from SMMR and SSM/I. Boulder, Colorado USA: National Snow and Ice Data Center. Digital media. Available at http://nsidc.org/data/smmr_ssmi_ancillary/monthly_means.html. Accessed 27 June 2008. Compiled from: Cavalieri, D., C. Parkinson, P. Gloersen, and H. J. Zwally. 1996. Sea ice concentrations from Nimbus-7 SMMR and DMSP SSM/I passive microwave data. Boulder, Colorado USA: National Snow and Ice Data Center. Digital media. Available at http://nsidc.org/data/nsidc-0051.html. Background: Sea ice extent includes all areas where sea ice concentration is greater than or equal to 15%. Monthly climatologies of sea ice concentration represent mean ice concentration percentages for each month over the entire time period 1979-2007, which is generated from passive microwave brightness temperature data derived from Nimbus-7 Scanning Multichannel Microwave Radiometer (SMMR) and Defense Meteorological Satellite Program (DMSP) -F8, -F11 and -F13 Special Sensor Microwave/Imager (SSM/I) radiances at a grid cell size of 25 x 25 km using the NASA Team algorithm developed by the Oceans and Ice Branch, Laboratory for Hydrospheric Processes at NASA Goddard Space Flight Center (GSFC).
sea ice extent, December (1979-2007) (sea_ice_extent_12)
Stroeve, J. and W. Meier. 1999, updated 2008. Sea Ice Trends and Climatologies from SMMR and SSM/I. Boulder, Colorado USA: National Snow and Ice Data Center. Digital media. Available at http://nsidc.org/data/smmr_ssmi_ancillary/monthly_means.html. Accessed 27 June 2008. Compiled from: Cavalieri, D., C. Parkinson, P. Gloersen, and H. J. Zwally. 1996. Sea ice concentrations from Nimbus-7 SMMR and DMSP SSM/I passive microwave data. Boulder, Colorado USA: National Snow and Ice Data Center. Digital media. Available at http://nsidc.org/data/nsidc-0051.html. Background: Sea ice extent includes all areas where sea ice concentration is greater than or equal to 15%. Monthly climatologies of sea ice concentration represent mean ice concentration percentages for each month over the entire time period 1979-2007, which is generated from passive microwave brightness temperature data derived from Nimbus-7 Scanning Multichannel Microwave Radiometer (SMMR) and Defense Meteorological Satellite Program (DMSP) -F8, -F11 and -F13 Special Sensor Microwave/Imager (SSM/I) radiances at a grid cell size of 25 x 25 km using the NASA Team algorithm developed by the Oceans and Ice Branch, Laboratory for Hydrospheric Processes at NASA Goddard Space Flight Center (GSFC).
sea ice concentration, January (1979-2007) (sea_ice_concentration_01)
Stroeve, J. and W. Meier. 1999, updated 2008. Sea Ice Trends and Climatologies from SMMR and SSM/I. Boulder, Colorado USA: National Snow and Ice Data Center. Digital media. Available at http://nsidc.org/data/smmr_ssmi_ancillary/monthly_means.html. Accessed 27 June 2008. Compiled from: Cavalieri, D., C. Parkinson, P. Gloersen, and H. J. Zwally. 1996. Sea ice concentrations from Nimbus-7 SMMR and DMSP SSM/I passive microwave data. Boulder, Colorado USA: National Snow and Ice Data Center. Digital media. Available at http://nsidc.org/data/nsidc-0051.html. Background: Monthly climatologies of sea ice concentration represent mean ice concentration percentages for each month over the entire time period 1979-2007, which is generated from passive microwave brightness temperature data derived from Nimbus-7 Scanning Multichannel Microwave Radiometer (SMMR) and Defense Meteorological Satellite Program (DMSP) -F8, -F11 and -F13 Special Sensor Microwave/Imager (SSM/I) radiances at a grid cell size of 25 x 25 km using the NASA Team algorithm developed by the Oceans and Ice Branch, Laboratory for Hydrospheric Processes at NASA Goddard Space Flight Center (GSFC). A threshold of 15 percent concentration has been applied to the monthly climatologies.
sea ice concentration, January (1979-2007): graded (5 classes) (sea_ice_concentration_01_graded_5classes)
Stroeve, J. and W. Meier. 1999, updated 2008. Sea Ice Trends and Climatologies from SMMR and SSM/I. Boulder, Colorado USA: National Snow and Ice Data Center. Digital media. Available at http://nsidc.org/data/smmr_ssmi_ancillary/monthly_means.html. Accessed 27 June 2008. Compiled from: Cavalieri, D., C. Parkinson, P. Gloersen, and H. J. Zwally. 1996. Sea ice concentrations from Nimbus-7 SMMR and DMSP SSM/I passive microwave data. Boulder, Colorado USA: National Snow and Ice Data Center. Digital media. Available at http://nsidc.org/data/nsidc-0051.html. Background: Monthly climatologies of sea ice concentration represent mean ice concentration percentages for each month over the entire time period 1979-2007, which is generated from passive microwave brightness temperature data derived from Nimbus-7 Scanning Multichannel Microwave Radiometer (SMMR) and Defense Meteorological Satellite Program (DMSP) -F8, -F11 and -F13 Special Sensor Microwave/Imager (SSM/I) radiances at a grid cell size of 25 x 25 km using the NASA Team algorithm developed by the Oceans and Ice Branch, Laboratory for Hydrospheric Processes at NASA Goddard Space Flight Center (GSFC). A threshold of 15 percent concentration has been applied to the monthly climatologies.
sea ice concentration, January (1979-2007): graded (18 classes) (sea_ice_concentration_01_graded_18classes)
Stroeve, J. and W. Meier. 1999, updated 2008. Sea Ice Trends and Climatologies from SMMR and SSM/I. Boulder, Colorado USA: National Snow and Ice Data Center. Digital media. Available at http://nsidc.org/data/smmr_ssmi_ancillary/monthly_means.html. Accessed 27 June 2008. Compiled from: Cavalieri, D., C. Parkinson, P. Gloersen, and H. J. Zwally. 1996. Sea ice concentrations from Nimbus-7 SMMR and DMSP SSM/I passive microwave data. Boulder, Colorado USA: National Snow and Ice Data Center. Digital media. Available at http://nsidc.org/data/nsidc-0051.html. Background: Monthly climatologies of sea ice concentration represent mean ice concentration percentages for each month over the entire time period 1979-2007, which is generated from passive microwave brightness temperature data derived from Nimbus-7 Scanning Multichannel Microwave Radiometer (SMMR) and Defense Meteorological Satellite Program (DMSP) -F8, -F11 and -F13 Special Sensor Microwave/Imager (SSM/I) radiances at a grid cell size of 25 x 25 km using the NASA Team algorithm developed by the Oceans and Ice Branch, Laboratory for Hydrospheric Processes at NASA Goddard Space Flight Center (GSFC). A threshold of 15 percent concentration has been applied to the monthly climatologies.
sea ice concentration, February (1979-2007) (sea_ice_concentration_02)
Stroeve, J. and W. Meier. 1999, updated 2008. Sea Ice Trends and Climatologies from SMMR and SSM/I. Boulder, Colorado USA: National Snow and Ice Data Center. Digital media. Available at http://nsidc.org/data/smmr_ssmi_ancillary/monthly_means.html. Accessed 27 June 2008. Compiled from: Cavalieri, D., C. Parkinson, P. Gloersen, and H. J. Zwally. 1996. Sea ice concentrations from Nimbus-7 SMMR and DMSP SSM/I passive microwave data. Boulder, Colorado USA: National Snow and Ice Data Center. Digital media. Available at http://nsidc.org/data/nsidc-0051.html. Background: Monthly climatologies of sea ice concentration represent mean ice concentration percentages for each month over the entire time period 1979-2007, which is generated from passive microwave brightness temperature data derived from Nimbus-7 Scanning Multichannel Microwave Radiometer (SMMR) and Defense Meteorological Satellite Program (DMSP) -F8, -F11 and -F13 Special Sensor Microwave/Imager (SSM/I) radiances at a grid cell size of 25 x 25 km using the NASA Team algorithm developed by the Oceans and Ice Branch, Laboratory for Hydrospheric Processes at NASA Goddard Space Flight Center (GSFC). A threshold of 15 percent concentration has been applied to the monthly climatologies.
sea ice concentration, February (1979-2007): graded (5 classes) (sea_ice_concentration_02_graded_5classes)
Stroeve, J. and W. Meier. 1999, updated 2008. Sea Ice Trends and Climatologies from SMMR and SSM/I. Boulder, Colorado USA: National Snow and Ice Data Center. Digital media. Available at http://nsidc.org/data/smmr_ssmi_ancillary/monthly_means.html. Accessed 27 June 2008. Compiled from: Cavalieri, D., C. Parkinson, P. Gloersen, and H. J. Zwally. 1996. Sea ice concentrations from Nimbus-7 SMMR and DMSP SSM/I passive microwave data. Boulder, Colorado USA: National Snow and Ice Data Center. Digital media. Available at http://nsidc.org/data/nsidc-0051.html. Background: Monthly climatologies of sea ice concentration represent mean ice concentration percentages for each month over the entire time period 1979-2007, which is generated from passive microwave brightness temperature data derived from Nimbus-7 Scanning Multichannel Microwave Radiometer (SMMR) and Defense Meteorological Satellite Program (DMSP) -F8, -F11 and -F13 Special Sensor Microwave/Imager (SSM/I) radiances at a grid cell size of 25 x 25 km using the NASA Team algorithm developed by the Oceans and Ice Branch, Laboratory for Hydrospheric Processes at NASA Goddard Space Flight Center (GSFC). A threshold of 15 percent concentration has been applied to the monthly climatologies.
sea ice concentration, February (1979-2007): graded (18 classes) (sea_ice_concentration_02_graded_18classes)
Stroeve, J. and W. Meier. 1999, updated 2008. Sea Ice Trends and Climatologies from SMMR and SSM/I. Boulder, Colorado USA: National Snow and Ice Data Center. Digital media. Available at http://nsidc.org/data/smmr_ssmi_ancillary/monthly_means.html. Accessed 27 June 2008. Compiled from: Cavalieri, D., C. Parkinson, P. Gloersen, and H. J. Zwally. 1996. Sea ice concentrations from Nimbus-7 SMMR and DMSP SSM/I passive microwave data. Boulder, Colorado USA: National Snow and Ice Data Center. Digital media. Available at http://nsidc.org/data/nsidc-0051.html. Background: Monthly climatologies of sea ice concentration represent mean ice concentration percentages for each month over the entire time period 1979-2007, which is generated from passive microwave brightness temperature data derived from Nimbus-7 Scanning Multichannel Microwave Radiometer (SMMR) and Defense Meteorological Satellite Program (DMSP) -F8, -F11 and -F13 Special Sensor Microwave/Imager (SSM/I) radiances at a grid cell size of 25 x 25 km using the NASA Team algorithm developed by the Oceans and Ice Branch, Laboratory for Hydrospheric Processes at NASA Goddard Space Flight Center (GSFC). A threshold of 15 percent concentration has been applied to the monthly climatologies.
sea ice concentration, March (1979-2007) (sea_ice_concentration_03)
Stroeve, J. and W. Meier. 1999, updated 2008. Sea Ice Trends and Climatologies from SMMR and SSM/I. Boulder, Colorado USA: National Snow and Ice Data Center. Digital media. Available at http://nsidc.org/data/smmr_ssmi_ancillary/monthly_means.html. Accessed 27 June 2008. Compiled from: Cavalieri, D., C. Parkinson, P. Gloersen, and H. J. Zwally. 1996. Sea ice concentrations from Nimbus-7 SMMR and DMSP SSM/I passive microwave data. Boulder, Colorado USA: National Snow and Ice Data Center. Digital media. Available at http://nsidc.org/data/nsidc-0051.html. Background: Monthly climatologies of sea ice concentration represent mean ice concentration percentages for each month over the entire time period 1979-2007, which is generated from passive microwave brightness temperature data derived from Nimbus-7 Scanning Multichannel Microwave Radiometer (SMMR) and Defense Meteorological Satellite Program (DMSP) -F8, -F11 and -F13 Special Sensor Microwave/Imager (SSM/I) radiances at a grid cell size of 25 x 25 km using the NASA Team algorithm developed by the Oceans and Ice Branch, Laboratory for Hydrospheric Processes at NASA Goddard Space Flight Center (GSFC). A threshold of 15 percent concentration has been applied to the monthly climatologies.
sea ice concentration, March (1979-2007): graded (5 classes) (sea_ice_concentration_03_graded_5classes)
Stroeve, J. and W. Meier. 1999, updated 2008. Sea Ice Trends and Climatologies from SMMR and SSM/I. Boulder, Colorado USA: National Snow and Ice Data Center. Digital media. Available at http://nsidc.org/data/smmr_ssmi_ancillary/monthly_means.html. Accessed 27 June 2008. Compiled from: Cavalieri, D., C. Parkinson, P. Gloersen, and H. J. Zwally. 1996. Sea ice concentrations from Nimbus-7 SMMR and DMSP SSM/I passive microwave data. Boulder, Colorado USA: National Snow and Ice Data Center. Digital media. Available at http://nsidc.org/data/nsidc-0051.html. Background: Monthly climatologies of sea ice concentration represent mean ice concentration percentages for each month over the entire time period 1979-2007, which is generated from passive microwave brightness temperature data derived from Nimbus-7 Scanning Multichannel Microwave Radiometer (SMMR) and Defense Meteorological Satellite Program (DMSP) -F8, -F11 and -F13 Special Sensor Microwave/Imager (SSM/I) radiances at a grid cell size of 25 x 25 km using the NASA Team algorithm developed by the Oceans and Ice Branch, Laboratory for Hydrospheric Processes at NASA Goddard Space Flight Center (GSFC). A threshold of 15 percent concentration has been applied to the monthly climatologies.
sea ice concentration, March (1979-2007): graded (18 classes) (sea_ice_concentration_03_graded_18classes)
Stroeve, J. and W. Meier. 1999, updated 2008. Sea Ice Trends and Climatologies from SMMR and SSM/I. Boulder, Colorado USA: National Snow and Ice Data Center. Digital media. Available at http://nsidc.org/data/smmr_ssmi_ancillary/monthly_means.html. Accessed 27 June 2008. Compiled from: Cavalieri, D., C. Parkinson, P. Gloersen, and H. J. Zwally. 1996. Sea ice concentrations from Nimbus-7 SMMR and DMSP SSM/I passive microwave data. Boulder, Colorado USA: National Snow and Ice Data Center. Digital media. Available at http://nsidc.org/data/nsidc-0051.html. Background: Monthly climatologies of sea ice concentration represent mean ice concentration percentages for each month over the entire time period 1979-2007, which is generated from passive microwave brightness temperature data derived from Nimbus-7 Scanning Multichannel Microwave Radiometer (SMMR) and Defense Meteorological Satellite Program (DMSP) -F8, -F11 and -F13 Special Sensor Microwave/Imager (SSM/I) radiances at a grid cell size of 25 x 25 km using the NASA Team algorithm developed by the Oceans and Ice Branch, Laboratory for Hydrospheric Processes at NASA Goddard Space Flight Center (GSFC). A threshold of 15 percent concentration has been applied to the monthly climatologies.
sea ice concentration, April (1979-2007) (sea_ice_concentration_04)
Stroeve, J. and W. Meier. 1999, updated 2008. Sea Ice Trends and Climatologies from SMMR and SSM/I. Boulder, Colorado USA: National Snow and Ice Data Center. Digital media. Available at http://nsidc.org/data/smmr_ssmi_ancillary/monthly_means.html. Accessed 27 June 2008. Compiled from: Cavalieri, D., C. Parkinson, P. Gloersen, and H. J. Zwally. 1996. Sea ice concentrations from Nimbus-7 SMMR and DMSP SSM/I passive microwave data. Boulder, Colorado USA: National Snow and Ice Data Center. Digital media. Available at http://nsidc.org/data/nsidc-0051.html. Background: Monthly climatologies of sea ice concentration represent mean ice concentration percentages for each month over the entire time period 1979-2007, which is generated from passive microwave brightness temperature data derived from Nimbus-7 Scanning Multichannel Microwave Radiometer (SMMR) and Defense Meteorological Satellite Program (DMSP) -F8, -F11 and -F13 Special Sensor Microwave/Imager (SSM/I) radiances at a grid cell size of 25 x 25 km using the NASA Team algorithm developed by the Oceans and Ice Branch, Laboratory for Hydrospheric Processes at NASA Goddard Space Flight Center (GSFC). A threshold of 15 percent concentration has been applied to the monthly climatologies.
sea ice concentration, April (1979-2007): graded (5 classes) (sea_ice_concentration_04_graded_5classes)
Stroeve, J. and W. Meier. 1999, updated 2008. Sea Ice Trends and Climatologies from SMMR and SSM/I. Boulder, Colorado USA: National Snow and Ice Data Center. Digital media. Available at http://nsidc.org/data/smmr_ssmi_ancillary/monthly_means.html. Accessed 27 June 2008. Compiled from: Cavalieri, D., C. Parkinson, P. Gloersen, and H. J. Zwally. 1996. Sea ice concentrations from Nimbus-7 SMMR and DMSP SSM/I passive microwave data. Boulder, Colorado USA: National Snow and Ice Data Center. Digital media. Available at http://nsidc.org/data/nsidc-0051.html. Background: Monthly climatologies of sea ice concentration represent mean ice concentration percentages for each month over the entire time period 1979-2007, which is generated from passive microwave brightness temperature data derived from Nimbus-7 Scanning Multichannel Microwave Radiometer (SMMR) and Defense Meteorological Satellite Program (DMSP) -F8, -F11 and -F13 Special Sensor Microwave/Imager (SSM/I) radiances at a grid cell size of 25 x 25 km using the NASA Team algorithm developed by the Oceans and Ice Branch, Laboratory for Hydrospheric Processes at NASA Goddard Space Flight Center (GSFC). A threshold of 15 percent concentration has been applied to the monthly climatologies.
sea ice concentration, April (1979-2007): graded (18 classes) (sea_ice_concentration_04_graded_18classes)
Stroeve, J. and W. Meier. 1999, updated 2008. Sea Ice Trends and Climatologies from SMMR and SSM/I. Boulder, Colorado USA: National Snow and Ice Data Center. Digital media. Available at http://nsidc.org/data/smmr_ssmi_ancillary/monthly_means.html. Accessed 27 June 2008. Compiled from: Cavalieri, D., C. Parkinson, P. Gloersen, and H. J. Zwally. 1996. Sea ice concentrations from Nimbus-7 SMMR and DMSP SSM/I passive microwave data. Boulder, Colorado USA: National Snow and Ice Data Center. Digital media. Available at http://nsidc.org/data/nsidc-0051.html. Background: Monthly climatologies of sea ice concentration represent mean ice concentration percentages for each month over the entire time period 1979-2007, which is generated from passive microwave brightness temperature data derived from Nimbus-7 Scanning Multichannel Microwave Radiometer (SMMR) and Defense Meteorological Satellite Program (DMSP) -F8, -F11 and -F13 Special Sensor Microwave/Imager (SSM/I) radiances at a grid cell size of 25 x 25 km using the NASA Team algorithm developed by the Oceans and Ice Branch, Laboratory for Hydrospheric Processes at NASA Goddard Space Flight Center (GSFC). A threshold of 15 percent concentration has been applied to the monthly climatologies.
sea ice concentration, May (1979-2007) (sea_ice_concentration_05)
Stroeve, J. and W. Meier. 1999, updated 2008. Sea Ice Trends and Climatologies from SMMR and SSM/I. Boulder, Colorado USA: National Snow and Ice Data Center. Digital media. Available at http://nsidc.org/data/smmr_ssmi_ancillary/monthly_means.html. Accessed 27 June 2008. Compiled from: Cavalieri, D., C. Parkinson, P. Gloersen, and H. J. Zwally. 1996. Sea ice concentrations from Nimbus-7 SMMR and DMSP SSM/I passive microwave data. Boulder, Colorado USA: National Snow and Ice Data Center. Digital media. Available at http://nsidc.org/data/nsidc-0051.html. Background: Monthly climatologies of sea ice concentration represent mean ice concentration percentages for each month over the entire time period 1979-2007, which is generated from passive microwave brightness temperature data derived from Nimbus-7 Scanning Multichannel Microwave Radiometer (SMMR) and Defense Meteorological Satellite Program (DMSP) -F8, -F11 and -F13 Special Sensor Microwave/Imager (SSM/I) radiances at a grid cell size of 25 x 25 km using the NASA Team algorithm developed by the Oceans and Ice Branch, Laboratory for Hydrospheric Processes at NASA Goddard Space Flight Center (GSFC). A threshold of 15 percent concentration has been applied to the monthly climatologies.
sea ice concentration, May (1979-2007): graded (5 classes) (sea_ice_concentration_05_graded_5classes)
Stroeve, J. and W. Meier. 1999, updated 2008. Sea Ice Trends and Climatologies from SMMR and SSM/I. Boulder, Colorado USA: National Snow and Ice Data Center. Digital media. Available at http://nsidc.org/data/smmr_ssmi_ancillary/monthly_means.html. Accessed 27 June 2008. Compiled from: Cavalieri, D., C. Parkinson, P. Gloersen, and H. J. Zwally. 1996. Sea ice concentrations from Nimbus-7 SMMR and DMSP SSM/I passive microwave data. Boulder, Colorado USA: National Snow and Ice Data Center. Digital media. Available at http://nsidc.org/data/nsidc-0051.html. Background: Monthly climatologies of sea ice concentration represent mean ice concentration percentages for each month over the entire time period 1979-2007, which is generated from passive microwave brightness temperature data derived from Nimbus-7 Scanning Multichannel Microwave Radiometer (SMMR) and Defense Meteorological Satellite Program (DMSP) -F8, -F11 and -F13 Special Sensor Microwave/Imager (SSM/I) radiances at a grid cell size of 25 x 25 km using the NASA Team algorithm developed by the Oceans and Ice Branch, Laboratory for Hydrospheric Processes at NASA Goddard Space Flight Center (GSFC). A threshold of 15 percent concentration has been applied to the monthly climatologies.
sea ice concentration, May (1979-2007): graded (18 classes) (sea_ice_concentration_05_graded_18classes)
Stroeve, J. and W. Meier. 1999, updated 2008. Sea Ice Trends and Climatologies from SMMR and SSM/I. Boulder, Colorado USA: National Snow and Ice Data Center. Digital media. Available at http://nsidc.org/data/smmr_ssmi_ancillary/monthly_means.html. Accessed 27 June 2008. Compiled from: Cavalieri, D., C. Parkinson, P. Gloersen, and H. J. Zwally. 1996. Sea ice concentrations from Nimbus-7 SMMR and DMSP SSM/I passive microwave data. Boulder, Colorado USA: National Snow and Ice Data Center. Digital media. Available at http://nsidc.org/data/nsidc-0051.html. Background: Monthly climatologies of sea ice concentration represent mean ice concentration percentages for each month over the entire time period 1979-2007, which is generated from passive microwave brightness temperature data derived from Nimbus-7 Scanning Multichannel Microwave Radiometer (SMMR) and Defense Meteorological Satellite Program (DMSP) -F8, -F11 and -F13 Special Sensor Microwave/Imager (SSM/I) radiances at a grid cell size of 25 x 25 km using the NASA Team algorithm developed by the Oceans and Ice Branch, Laboratory for Hydrospheric Processes at NASA Goddard Space Flight Center (GSFC). A threshold of 15 percent concentration has been applied to the monthly climatologies.
sea ice concentration, June (1979-2007) (sea_ice_concentration_06)
Stroeve, J. and W. Meier. 1999, updated 2008. Sea Ice Trends and Climatologies from SMMR and SSM/I. Boulder, Colorado USA: National Snow and Ice Data Center. Digital media. Available at http://nsidc.org/data/smmr_ssmi_ancillary/monthly_means.html. Accessed 27 June 2008. Compiled from: Cavalieri, D., C. Parkinson, P. Gloersen, and H. J. Zwally. 1996. Sea ice concentrations from Nimbus-7 SMMR and DMSP SSM/I passive microwave data. Boulder, Colorado USA: National Snow and Ice Data Center. Digital media. Available at http://nsidc.org/data/nsidc-0051.html. Background: Monthly climatologies of sea ice concentration represent mean ice concentration percentages for each month over the entire time period 1979-2007, which is generated from passive microwave brightness temperature data derived from Nimbus-7 Scanning Multichannel Microwave Radiometer (SMMR) and Defense Meteorological Satellite Program (DMSP) -F8, -F11 and -F13 Special Sensor Microwave/Imager (SSM/I) radiances at a grid cell size of 25 x 25 km using the NASA Team algorithm developed by the Oceans and Ice Branch, Laboratory for Hydrospheric Processes at NASA Goddard Space Flight Center (GSFC). A threshold of 15 percent concentration has been applied to the monthly climatologies.
sea ice concentration, June (1979-2007): graded (5 classes) (sea_ice_concentration_06_graded_5classes)
Stroeve, J. and W. Meier. 1999, updated 2008. Sea Ice Trends and Climatologies from SMMR and SSM/I. Boulder, Colorado USA: National Snow and Ice Data Center. Digital media. Available at http://nsidc.org/data/smmr_ssmi_ancillary/monthly_means.html. Accessed 27 June 2008. Compiled from: Cavalieri, D., C. Parkinson, P. Gloersen, and H. J. Zwally. 1996. Sea ice concentrations from Nimbus-7 SMMR and DMSP SSM/I passive microwave data. Boulder, Colorado USA: National Snow and Ice Data Center. Digital media. Available at http://nsidc.org/data/nsidc-0051.html. Background: Monthly climatologies of sea ice concentration represent mean ice concentration percentages for each month over the entire time period 1979-2007, which is generated from passive microwave brightness temperature data derived from Nimbus-7 Scanning Multichannel Microwave Radiometer (SMMR) and Defense Meteorological Satellite Program (DMSP) -F8, -F11 and -F13 Special Sensor Microwave/Imager (SSM/I) radiances at a grid cell size of 25 x 25 km using the NASA Team algorithm developed by the Oceans and Ice Branch, Laboratory for Hydrospheric Processes at NASA Goddard Space Flight Center (GSFC). A threshold of 15 percent concentration has been applied to the monthly climatologies.
sea ice concentration, June (1979-2007): graded (18 classes) (sea_ice_concentration_06_graded_18classes)
Stroeve, J. and W. Meier. 1999, updated 2008. Sea Ice Trends and Climatologies from SMMR and SSM/I. Boulder, Colorado USA: National Snow and Ice Data Center. Digital media. Available at http://nsidc.org/data/smmr_ssmi_ancillary/monthly_means.html. Accessed 27 June 2008. Compiled from: Cavalieri, D., C. Parkinson, P. Gloersen, and H. J. Zwally. 1996. Sea ice concentrations from Nimbus-7 SMMR and DMSP SSM/I passive microwave data. Boulder, Colorado USA: National Snow and Ice Data Center. Digital media. Available at http://nsidc.org/data/nsidc-0051.html. Background: Monthly climatologies of sea ice concentration represent mean ice concentration percentages for each month over the entire time period 1979-2007, which is generated from passive microwave brightness temperature data derived from Nimbus-7 Scanning Multichannel Microwave Radiometer (SMMR) and Defense Meteorological Satellite Program (DMSP) -F8, -F11 and -F13 Special Sensor Microwave/Imager (SSM/I) radiances at a grid cell size of 25 x 25 km using the NASA Team algorithm developed by the Oceans and Ice Branch, Laboratory for Hydrospheric Processes at NASA Goddard Space Flight Center (GSFC). A threshold of 15 percent concentration has been applied to the monthly climatologies.
sea ice concentration, July (1979-2007) (sea_ice_concentration_07)
Stroeve, J. and W. Meier. 1999, updated 2008. Sea Ice Trends and Climatologies from SMMR and SSM/I. Boulder, Colorado USA: National Snow and Ice Data Center. Digital media. Available at http://nsidc.org/data/smmr_ssmi_ancillary/monthly_means.html. Accessed 27 June 2008. Compiled from: Cavalieri, D., C. Parkinson, P. Gloersen, and H. J. Zwally. 1996. Sea ice concentrations from Nimbus-7 SMMR and DMSP SSM/I passive microwave data. Boulder, Colorado USA: National Snow and Ice Data Center. Digital media. Available at http://nsidc.org/data/nsidc-0051.html. Background: Monthly climatologies of sea ice concentration represent mean ice concentration percentages for each month over the entire time period 1979-2007, which is generated from passive microwave brightness temperature data derived from Nimbus-7 Scanning Multichannel Microwave Radiometer (SMMR) and Defense Meteorological Satellite Program (DMSP) -F8, -F11 and -F13 Special Sensor Microwave/Imager (SSM/I) radiances at a grid cell size of 25 x 25 km using the NASA Team algorithm developed by the Oceans and Ice Branch, Laboratory for Hydrospheric Processes at NASA Goddard Space Flight Center (GSFC). A threshold of 15 percent concentration has been applied to the monthly climatologies.
sea ice concentration, July (1979-2007): graded (5 classes) (sea_ice_concentration_07_graded_5classes)
Stroeve, J. and W. Meier. 1999, updated 2008. Sea Ice Trends and Climatologies from SMMR and SSM/I. Boulder, Colorado USA: National Snow and Ice Data Center. Digital media. Available at http://nsidc.org/data/smmr_ssmi_ancillary/monthly_means.html. Accessed 27 June 2008. Compiled from: Cavalieri, D., C. Parkinson, P. Gloersen, and H. J. Zwally. 1996. Sea ice concentrations from Nimbus-7 SMMR and DMSP SSM/I passive microwave data. Boulder, Colorado USA: National Snow and Ice Data Center. Digital media. Available at http://nsidc.org/data/nsidc-0051.html. Background: Monthly climatologies of sea ice concentration represent mean ice concentration percentages for each month over the entire time period 1979-2007, which is generated from passive microwave brightness temperature data derived from Nimbus-7 Scanning Multichannel Microwave Radiometer (SMMR) and Defense Meteorological Satellite Program (DMSP) -F8, -F11 and -F13 Special Sensor Microwave/Imager (SSM/I) radiances at a grid cell size of 25 x 25 km using the NASA Team algorithm developed by the Oceans and Ice Branch, Laboratory for Hydrospheric Processes at NASA Goddard Space Flight Center (GSFC). A threshold of 15 percent concentration has been applied to the monthly climatologies.
sea ice concentration, July (1979-2007): graded (18 classes) (sea_ice_concentration_07_graded_18classes)
Stroeve, J. and W. Meier. 1999, updated 2008. Sea Ice Trends and Climatologies from SMMR and SSM/I. Boulder, Colorado USA: National Snow and Ice Data Center. Digital media. Available at http://nsidc.org/data/smmr_ssmi_ancillary/monthly_means.html. Accessed 27 June 2008. Compiled from: Cavalieri, D., C. Parkinson, P. Gloersen, and H. J. Zwally. 1996. Sea ice concentrations from Nimbus-7 SMMR and DMSP SSM/I passive microwave data. Boulder, Colorado USA: National Snow and Ice Data Center. Digital media. Available at http://nsidc.org/data/nsidc-0051.html. Background: Monthly climatologies of sea ice concentration represent mean ice concentration percentages for each month over the entire time period 1979-2007, which is generated from passive microwave brightness temperature data derived from Nimbus-7 Scanning Multichannel Microwave Radiometer (SMMR) and Defense Meteorological Satellite Program (DMSP) -F8, -F11 and -F13 Special Sensor Microwave/Imager (SSM/I) radiances at a grid cell size of 25 x 25 km using the NASA Team algorithm developed by the Oceans and Ice Branch, Laboratory for Hydrospheric Processes at NASA Goddard Space Flight Center (GSFC). A threshold of 15 percent concentration has been applied to the monthly climatologies.
sea ice concentration, August (1979-2007) (sea_ice_concentration_08)
Stroeve, J. and W. Meier. 1999, updated 2008. Sea Ice Trends and Climatologies from SMMR and SSM/I. Boulder, Colorado USA: National Snow and Ice Data Center. Digital media. Available at http://nsidc.org/data/smmr_ssmi_ancillary/monthly_means.html. Accessed 27 June 2008. Compiled from: Cavalieri, D., C. Parkinson, P. Gloersen, and H. J. Zwally. 1996. Sea ice concentrations from Nimbus-7 SMMR and DMSP SSM/I passive microwave data. Boulder, Colorado USA: National Snow and Ice Data Center. Digital media. Available at http://nsidc.org/data/nsidc-0051.html. Background: Monthly climatologies of sea ice concentration represent mean ice concentration percentages for each month over the entire time period 1979-2007, which is generated from passive microwave brightness temperature data derived from Nimbus-7 Scanning Multichannel Microwave Radiometer (SMMR) and Defense Meteorological Satellite Program (DMSP) -F8, -F11 and -F13 Special Sensor Microwave/Imager (SSM/I) radiances at a grid cell size of 25 x 25 km using the NASA Team algorithm developed by the Oceans and Ice Branch, Laboratory for Hydrospheric Processes at NASA Goddard Space Flight Center (GSFC). A threshold of 15 percent concentration has been applied to the monthly climatologies.
sea ice concentration, August (1979-2007): graded (5 classes) (sea_ice_concentration_08_graded_5classes)
Stroeve, J. and W. Meier. 1999, updated 2008. Sea Ice Trends and Climatologies from SMMR and SSM/I. Boulder, Colorado USA: National Snow and Ice Data Center. Digital media. Available at http://nsidc.org/data/smmr_ssmi_ancillary/monthly_means.html. Accessed 27 June 2008. Compiled from: Cavalieri, D., C. Parkinson, P. Gloersen, and H. J. Zwally. 1996. Sea ice concentrations from Nimbus-7 SMMR and DMSP SSM/I passive microwave data. Boulder, Colorado USA: National Snow and Ice Data Center. Digital media. Available at http://nsidc.org/data/nsidc-0051.html. Background: Monthly climatologies of sea ice concentration represent mean ice concentration percentages for each month over the entire time period 1979-2007, which is generated from passive microwave brightness temperature data derived from Nimbus-7 Scanning Multichannel Microwave Radiometer (SMMR) and Defense Meteorological Satellite Program (DMSP) -F8, -F11 and -F13 Special Sensor Microwave/Imager (SSM/I) radiances at a grid cell size of 25 x 25 km using the NASA Team algorithm developed by the Oceans and Ice Branch, Laboratory for Hydrospheric Processes at NASA Goddard Space Flight Center (GSFC). A threshold of 15 percent concentration has been applied to the monthly climatologies.
sea ice concentration, August (1979-2007): graded (18 classes) (sea_ice_concentration_08_graded_18classes)
Stroeve, J. and W. Meier. 1999, updated 2008. Sea Ice Trends and Climatologies from SMMR and SSM/I. Boulder, Colorado USA: National Snow and Ice Data Center. Digital media. Available at http://nsidc.org/data/smmr_ssmi_ancillary/monthly_means.html. Accessed 27 June 2008. Compiled from: Cavalieri, D., C. Parkinson, P. Gloersen, and H. J. Zwally. 1996. Sea ice concentrations from Nimbus-7 SMMR and DMSP SSM/I passive microwave data. Boulder, Colorado USA: National Snow and Ice Data Center. Digital media. Available at http://nsidc.org/data/nsidc-0051.html. Background: Monthly climatologies of sea ice concentration represent mean ice concentration percentages for each month over the entire time period 1979-2007, which is generated from passive microwave brightness temperature data derived from Nimbus-7 Scanning Multichannel Microwave Radiometer (SMMR) and Defense Meteorological Satellite Program (DMSP) -F8, -F11 and -F13 Special Sensor Microwave/Imager (SSM/I) radiances at a grid cell size of 25 x 25 km using the NASA Team algorithm developed by the Oceans and Ice Branch, Laboratory for Hydrospheric Processes at NASA Goddard Space Flight Center (GSFC). A threshold of 15 percent concentration has been applied to the monthly climatologies.
sea ice concentration, September (1979-2007) (sea_ice_concentration_09)
Stroeve, J. and W. Meier. 1999, updated 2008. Sea Ice Trends and Climatologies from SMMR and SSM/I. Boulder, Colorado USA: National Snow and Ice Data Center. Digital media. Available at http://nsidc.org/data/smmr_ssmi_ancillary/monthly_means.html. Accessed 27 June 2008. Compiled from: Cavalieri, D., C. Parkinson, P. Gloersen, and H. J. Zwally. 1996. Sea ice concentrations from Nimbus-7 SMMR and DMSP SSM/I passive microwave data. Boulder, Colorado USA: National Snow and Ice Data Center. Digital media. Available at http://nsidc.org/data/nsidc-0051.html. Background: Monthly climatologies of sea ice concentration represent mean ice concentration percentages for each month over the entire time period 1979-2007, which is generated from passive microwave brightness temperature data derived from Nimbus-7 Scanning Multichannel Microwave Radiometer (SMMR) and Defense Meteorological Satellite Program (DMSP) -F8, -F11 and -F13 Special Sensor Microwave/Imager (SSM/I) radiances at a grid cell size of 25 x 25 km using the NASA Team algorithm developed by the Oceans and Ice Branch, Laboratory for Hydrospheric Processes at NASA Goddard Space Flight Center (GSFC). A threshold of 15 percent concentration has been applied to the monthly climatologies.
sea ice concentration, September (1979-2007): graded (5 classes) (sea_ice_concentration_09_graded_5classes)
Stroeve, J. and W. Meier. 1999, updated 2008. Sea Ice Trends and Climatologies from SMMR and SSM/I. Boulder, Colorado USA: National Snow and Ice Data Center. Digital media. Available at http://nsidc.org/data/smmr_ssmi_ancillary/monthly_means.html. Accessed 27 June 2008. Compiled from: Cavalieri, D., C. Parkinson, P. Gloersen, and H. J. Zwally. 1996. Sea ice concentrations from Nimbus-7 SMMR and DMSP SSM/I passive microwave data. Boulder, Colorado USA: National Snow and Ice Data Center. Digital media. Available at http://nsidc.org/data/nsidc-0051.html. Background: Monthly climatologies of sea ice concentration represent mean ice concentration percentages for each month over the entire time period 1979-2007, which is generated from passive microwave brightness temperature data derived from Nimbus-7 Scanning Multichannel Microwave Radiometer (SMMR) and Defense Meteorological Satellite Program (DMSP) -F8, -F11 and -F13 Special Sensor Microwave/Imager (SSM/I) radiances at a grid cell size of 25 x 25 km using the NASA Team algorithm developed by the Oceans and Ice Branch, Laboratory for Hydrospheric Processes at NASA Goddard Space Flight Center (GSFC). A threshold of 15 percent concentration has been applied to the monthly climatologies.
sea ice concentration, September (1979-2007): graded (18 classes) (sea_ice_concentration_09_graded_18classes)
Stroeve, J. and W. Meier. 1999, updated 2008. Sea Ice Trends and Climatologies from SMMR and SSM/I. Boulder, Colorado USA: National Snow and Ice Data Center. Digital media. Available at http://nsidc.org/data/smmr_ssmi_ancillary/monthly_means.html. Accessed 27 June 2008. Compiled from: Cavalieri, D., C. Parkinson, P. Gloersen, and H. J. Zwally. 1996. Sea ice concentrations from Nimbus-7 SMMR and DMSP SSM/I passive microwave data. Boulder, Colorado USA: National Snow and Ice Data Center. Digital media. Available at http://nsidc.org/data/nsidc-0051.html. Background: Monthly climatologies of sea ice concentration represent mean ice concentration percentages for each month over the entire time period 1979-2007, which is generated from passive microwave brightness temperature data derived from Nimbus-7 Scanning Multichannel Microwave Radiometer (SMMR) and Defense Meteorological Satellite Program (DMSP) -F8, -F11 and -F13 Special Sensor Microwave/Imager (SSM/I) radiances at a grid cell size of 25 x 25 km using the NASA Team algorithm developed by the Oceans and Ice Branch, Laboratory for Hydrospheric Processes at NASA Goddard Space Flight Center (GSFC). A threshold of 15 percent concentration has been applied to the monthly climatologies.
sea ice concentration, October (1979-2007) (sea_ice_concentration_10)
Stroeve, J. and W. Meier. 1999, updated 2008. Sea Ice Trends and Climatologies from SMMR and SSM/I. Boulder, Colorado USA: National Snow and Ice Data Center. Digital media. Available at http://nsidc.org/data/smmr_ssmi_ancillary/monthly_means.html. Accessed 27 June 2008. Compiled from: Cavalieri, D., C. Parkinson, P. Gloersen, and H. J. Zwally. 1996. Sea ice concentrations from Nimbus-7 SMMR and DMSP SSM/I passive microwave data. Boulder, Colorado USA: National Snow and Ice Data Center. Digital media. Available at http://nsidc.org/data/nsidc-0051.html. Background: Monthly climatologies of sea ice concentration represent mean ice concentration percentages for each month over the entire time period 1979-2007, which is generated from passive microwave brightness temperature data derived from Nimbus-7 Scanning Multichannel Microwave Radiometer (SMMR) and Defense Meteorological Satellite Program (DMSP) -F8, -F11 and -F13 Special Sensor Microwave/Imager (SSM/I) radiances at a grid cell size of 25 x 25 km using the NASA Team algorithm developed by the Oceans and Ice Branch, Laboratory for Hydrospheric Processes at NASA Goddard Space Flight Center (GSFC). A threshold of 15 percent concentration has been applied to the monthly climatologies.
sea ice concentration, October (1979-2007): graded (5 classes) (sea_ice_concentration_10_graded_5classes)
Stroeve, J. and W. Meier. 1999, updated 2008. Sea Ice Trends and Climatologies from SMMR and SSM/I. Boulder, Colorado USA: National Snow and Ice Data Center. Digital media. Available at http://nsidc.org/data/smmr_ssmi_ancillary/monthly_means.html. Accessed 27 June 2008. Compiled from: Cavalieri, D., C. Parkinson, P. Gloersen, and H. J. Zwally. 1996. Sea ice concentrations from Nimbus-7 SMMR and DMSP SSM/I passive microwave data. Boulder, Colorado USA: National Snow and Ice Data Center. Digital media. Available at http://nsidc.org/data/nsidc-0051.html. Background: Monthly climatologies of sea ice concentration represent mean ice concentration percentages for each month over the entire time period 1979-2007, which is generated from passive microwave brightness temperature data derived from Nimbus-7 Scanning Multichannel Microwave Radiometer (SMMR) and Defense Meteorological Satellite Program (DMSP) -F8, -F11 and -F13 Special Sensor Microwave/Imager (SSM/I) radiances at a grid cell size of 25 x 25 km using the NASA Team algorithm developed by the Oceans and Ice Branch, Laboratory for Hydrospheric Processes at NASA Goddard Space Flight Center (GSFC). A threshold of 15 percent concentration has been applied to the monthly climatologies.
sea ice concentration, October (1979-2007): graded (18 classes) (sea_ice_concentration_10_graded_18classes)
Stroeve, J. and W. Meier. 1999, updated 2008. Sea Ice Trends and Climatologies from SMMR and SSM/I. Boulder, Colorado USA: National Snow and Ice Data Center. Digital media. Available at http://nsidc.org/data/smmr_ssmi_ancillary/monthly_means.html. Accessed 27 June 2008. Compiled from: Cavalieri, D., C. Parkinson, P. Gloersen, and H. J. Zwally. 1996. Sea ice concentrations from Nimbus-7 SMMR and DMSP SSM/I passive microwave data. Boulder, Colorado USA: National Snow and Ice Data Center. Digital media. Available at http://nsidc.org/data/nsidc-0051.html. Background: Monthly climatologies of sea ice concentration represent mean ice concentration percentages for each month over the entire time period 1979-2007, which is generated from passive microwave brightness temperature data derived from Nimbus-7 Scanning Multichannel Microwave Radiometer (SMMR) and Defense Meteorological Satellite Program (DMSP) -F8, -F11 and -F13 Special Sensor Microwave/Imager (SSM/I) radiances at a grid cell size of 25 x 25 km using the NASA Team algorithm developed by the Oceans and Ice Branch, Laboratory for Hydrospheric Processes at NASA Goddard Space Flight Center (GSFC). A threshold of 15 percent concentration has been applied to the monthly climatologies.
sea ice concentration, November (1979-2007) (sea_ice_concentration_11)
Stroeve, J. and W. Meier. 1999, updated 2008. Sea Ice Trends and Climatologies from SMMR and SSM/I. Boulder, Colorado USA: National Snow and Ice Data Center. Digital media. Available at http://nsidc.org/data/smmr_ssmi_ancillary/monthly_means.html. Accessed 27 June 2008. Compiled from: Cavalieri, D., C. Parkinson, P. Gloersen, and H. J. Zwally. 1996. Sea ice concentrations from Nimbus-7 SMMR and DMSP SSM/I passive microwave data. Boulder, Colorado USA: National Snow and Ice Data Center. Digital media. Available at http://nsidc.org/data/nsidc-0051.html. Background: Monthly climatologies of sea ice concentration represent mean ice concentration percentages for each month over the entire time period 1979-2007, which is generated from passive microwave brightness temperature data derived from Nimbus-7 Scanning Multichannel Microwave Radiometer (SMMR) and Defense Meteorological Satellite Program (DMSP) -F8, -F11 and -F13 Special Sensor Microwave/Imager (SSM/I) radiances at a grid cell size of 25 x 25 km using the NASA Team algorithm developed by the Oceans and Ice Branch, Laboratory for Hydrospheric Processes at NASA Goddard Space Flight Center (GSFC). A threshold of 15 percent concentration has been applied to the monthly climatologies.
sea ice concentration, November (1979-2007): graded (5 classes) (sea_ice_concentration_11_graded_5classes)
Stroeve, J. and W. Meier. 1999, updated 2008. Sea Ice Trends and Climatologies from SMMR and SSM/I. Boulder, Colorado USA: National Snow and Ice Data Center. Digital media. Available at http://nsidc.org/data/smmr_ssmi_ancillary/monthly_means.html. Accessed 27 June 2008. Compiled from: Cavalieri, D., C. Parkinson, P. Gloersen, and H. J. Zwally. 1996. Sea ice concentrations from Nimbus-7 SMMR and DMSP SSM/I passive microwave data. Boulder, Colorado USA: National Snow and Ice Data Center. Digital media. Available at http://nsidc.org/data/nsidc-0051.html. Background: Monthly climatologies of sea ice concentration represent mean ice concentration percentages for each month over the entire time period 1979-2007, which is generated from passive microwave brightness temperature data derived from Nimbus-7 Scanning Multichannel Microwave Radiometer (SMMR) and Defense Meteorological Satellite Program (DMSP) -F8, -F11 and -F13 Special Sensor Microwave/Imager (SSM/I) radiances at a grid cell size of 25 x 25 km using the NASA Team algorithm developed by the Oceans and Ice Branch, Laboratory for Hydrospheric Processes at NASA Goddard Space Flight Center (GSFC). A threshold of 15 percent concentration has been applied to the monthly climatologies.
sea ice concentration, November (1979-2007): graded (18 classes) (sea_ice_concentration_11_graded_18classes)
Stroeve, J. and W. Meier. 1999, updated 2008. Sea Ice Trends and Climatologies from SMMR and SSM/I. Boulder, Colorado USA: National Snow and Ice Data Center. Digital media. Available at http://nsidc.org/data/smmr_ssmi_ancillary/monthly_means.html. Accessed 27 June 2008. Compiled from: Cavalieri, D., C. Parkinson, P. Gloersen, and H. J. Zwally. 1996. Sea ice concentrations from Nimbus-7 SMMR and DMSP SSM/I passive microwave data. Boulder, Colorado USA: National Snow and Ice Data Center. Digital media. Available at http://nsidc.org/data/nsidc-0051.html. Background: Monthly climatologies of sea ice concentration represent mean ice concentration percentages for each month over the entire time period 1979-2007, which is generated from passive microwave brightness temperature data derived from Nimbus-7 Scanning Multichannel Microwave Radiometer (SMMR) and Defense Meteorological Satellite Program (DMSP) -F8, -F11 and -F13 Special Sensor Microwave/Imager (SSM/I) radiances at a grid cell size of 25 x 25 km using the NASA Team algorithm developed by the Oceans and Ice Branch, Laboratory for Hydrospheric Processes at NASA Goddard Space Flight Center (GSFC). A threshold of 15 percent concentration has been applied to the monthly climatologies.
sea ice concentration, December (1979-2007) (sea_ice_concentration_12)
Stroeve, J. and W. Meier. 1999, updated 2008. Sea Ice Trends and Climatologies from SMMR and SSM/I. Boulder, Colorado USA: National Snow and Ice Data Center. Digital media. Available at http://nsidc.org/data/smmr_ssmi_ancillary/monthly_means.html. Accessed 27 June 2008. Compiled from: Cavalieri, D., C. Parkinson, P. Gloersen, and H. J. Zwally. 1996. Sea ice concentrations from Nimbus-7 SMMR and DMSP SSM/I passive microwave data. Boulder, Colorado USA: National Snow and Ice Data Center. Digital media. Available at http://nsidc.org/data/nsidc-0051.html. Background: Monthly climatologies of sea ice concentration represent mean ice concentration percentages for each month over the entire time period 1979-2007, which is generated from passive microwave brightness temperature data derived from Nimbus-7 Scanning Multichannel Microwave Radiometer (SMMR) and Defense Meteorological Satellite Program (DMSP) -F8, -F11 and -F13 Special Sensor Microwave/Imager (SSM/I) radiances at a grid cell size of 25 x 25 km using the NASA Team algorithm developed by the Oceans and Ice Branch, Laboratory for Hydrospheric Processes at NASA Goddard Space Flight Center (GSFC). A threshold of 15 percent concentration has been applied to the monthly climatologies.
sea ice concentration, December (1979-2007): graded (5 classes) (sea_ice_concentration_12_graded_5classes)
Stroeve, J. and W. Meier. 1999, updated 2008. Sea Ice Trends and Climatologies from SMMR and SSM/I. Boulder, Colorado USA: National Snow and Ice Data Center. Digital media. Available at http://nsidc.org/data/smmr_ssmi_ancillary/monthly_means.html. Accessed 27 June 2008. Compiled from: Cavalieri, D., C. Parkinson, P. Gloersen, and H. J. Zwally. 1996. Sea ice concentrations from Nimbus-7 SMMR and DMSP SSM/I passive microwave data. Boulder, Colorado USA: National Snow and Ice Data Center. Digital media. Available at http://nsidc.org/data/nsidc-0051.html. Background: Monthly climatologies of sea ice concentration represent mean ice concentration percentages for each month over the entire time period 1979-2007, which is generated from passive microwave brightness temperature data derived from Nimbus-7 Scanning Multichannel Microwave Radiometer (SMMR) and Defense Meteorological Satellite Program (DMSP) -F8, -F11 and -F13 Special Sensor Microwave/Imager (SSM/I) radiances at a grid cell size of 25 x 25 km using the NASA Team algorithm developed by the Oceans and Ice Branch, Laboratory for Hydrospheric Processes at NASA Goddard Space Flight Center (GSFC). A threshold of 15 percent concentration has been applied to the monthly climatologies.
sea ice concentration, December (1979-2007): graded (18 classes) (sea_ice_concentration_12_graded_18classes)
Stroeve, J. and W. Meier. 1999, updated 2008. Sea Ice Trends and Climatologies from SMMR and SSM/I. Boulder, Colorado USA: National Snow and Ice Data Center. Digital media. Available at http://nsidc.org/data/smmr_ssmi_ancillary/monthly_means.html. Accessed 27 June 2008. Compiled from: Cavalieri, D., C. Parkinson, P. Gloersen, and H. J. Zwally. 1996. Sea ice concentrations from Nimbus-7 SMMR and DMSP SSM/I passive microwave data. Boulder, Colorado USA: National Snow and Ice Data Center. Digital media. Available at http://nsidc.org/data/nsidc-0051.html. Background: Monthly climatologies of sea ice concentration represent mean ice concentration percentages for each month over the entire time period 1979-2007, which is generated from passive microwave brightness temperature data derived from Nimbus-7 Scanning Multichannel Microwave Radiometer (SMMR) and Defense Meteorological Satellite Program (DMSP) -F8, -F11 and -F13 Special Sensor Microwave/Imager (SSM/I) radiances at a grid cell size of 25 x 25 km using the NASA Team algorithm developed by the Oceans and Ice Branch, Laboratory for Hydrospheric Processes at NASA Goddard Space Flight Center (GSFC). A threshold of 15 percent concentration has been applied to the monthly climatologies.
land (land)
Four separate layers are used to map land in the Southern Hemisphere: (1.) the Gridded Population of the World Version 3 (GPWv3) for everything but Antarctica; and NSIDC's MODIS Mosaic of Antarctica (MOA)-based polygons for Antarctica's (2.) islands, (3.) grounding line or continent (excludes the ice shelves), and (4.) coastline (includes the ice shelves and is given a different color than the previous three layers). These sources are documented and cited in their respective layers below.
Antarctic ice shelves (antarctica_ice_shelves)
Bohlander, J. and T. Scambos. 2007. Antarctic coastlines and grounding line derived from MODIS Mosaic of Antarctica (MOA). Boulder, Colorado USA: National Snow and Ice Data Center. Digital media. Accessed 24 April 2008. Background: These outlines were hand-digitized from the Moderate-resolution Imaging Spectroradiometer (MODIS) mosaic of Antarctica (MOA) image map produced and distributed by the National Snow and Ice Data Center (NSIDC) at: http://nsidc.org/data/nsidc-0280.html. The coastline includes the ice shelves surrounding Antarctica while the grounding line excludes them. Coastlines for islands surrounding Antarctica are provided separately from the rest of Antarctica's grounding line.
Antarctic continent (antarctica_continent)
Bohlander, J. and T. Scambos. 2007. Antarctic coastlines and grounding line derived from MODIS Mosaic of Antarctica (MOA). Boulder, Colorado USA: National Snow and Ice Data Center. Digital media. Accessed 24 April 2008. Background: These outlines were hand-digitized from the Moderate-resolution Imaging Spectroradiometer (MODIS) mosaic of Antarctica (MOA) image map produced and distributed by the National Snow and Ice Data Center (NSIDC) at: http://nsidc.org/data/nsidc-0280.html. The coastline includes the ice shelves surrounding Antarctica while the grounding line excludes them. Coastlines for islands surrounding Antarctica are provided separately from the rest of Antarctica's grounding line.
Antarctic islands (antarctica_islands)
Bohlander, J. and T. Scambos. 2007. Antarctic coastlines and grounding line derived from MODIS Mosaic of Antarctica (MOA). Boulder, Colorado USA: National Snow and Ice Data Center. Digital media. Accessed 24 April 2008. Background: These outlines were hand-digitized from the Moderate-resolution Imaging Spectroradiometer (MODIS) mosaic of Antarctica (MOA) image map produced and distributed by the National Snow and Ice Data Center (NSIDC) at: http://nsidc.org/data/nsidc-0280.html. The coastline includes the ice shelves surrounding Antarctica while the grounding line excludes them. Coastlines for islands surrounding Antarctica are provided separately from the rest of Antarctica's grounding line.
land (excluding Antarctica) (land_excluding_antarctica)
Center for International Earth Science Information Network (CIESIN), Columbia University; and Centro Internacional de Agricultura Tropical (CIAT). 2005. Gridded Population of the World Version 3 (GPWv3): Coastlines. Palisades, NY, USA: Socioeconomic Data and Applications Center (SEDAC), Columbia University. Available at http://sedac.ciesin.columbia.edu/gpw. 19 January 2007. Background: Coastlines derived from the Gridded Population of the World (GPW) land area grid at 2.5 arc-minute resolution. Permanent ice and all but large lakes have been merged with neighbouring polygons to make a layer more appropriate for cartographic visualization of the data. Does not include Antarctica.
MODIS Mosaic of Antarctica (MOA) Image Map: nominal contrast (moa)
Haran, T., J. Bohlander, T. Scambos, T. Painter, and M. Fahnestock compilers. 2005, updated 2006. MODIS mosaic of Antarctica (MOA) image map. Boulder, CO, USA: National Snow and Ice Data Center. Digital media. Available at http://nsidc.org/data/nsidc-0280.html. Background: The MODIS Mosaic of Antarctica (MOA) surface morphology image map is derived from composites of 260 MODIS (Moderate-resolution Imaging Spectroradiometer) orbit swaths acquired between 20 November 2003 and 29 February 2004. The MOA provides a cloud-free view of the ice sheet, ice shelves, and land surfaces. All land areas larger than a few hundred meters that are south of 60 deg S are included in the mosaic, as well as persistent fast ice regions and some grounded icebergs present near the coast in the 2003-2004 austral summer. The MOA surface morphology image map is derived from digitally processed MODIS Band 1 data: this is viewable here at a grid scale of 125 m and using a nominal contrast stretch with minimum and maximum surface brightness values of 15000 and 17000 respectively.
MODIS Mosaic of Antarctica (MOA) Image Map: ultra-high contrast (moa_uhc)
Haran, T., J. Bohlander, T. Scambos, T. Painter, and M. Fahnestock compilers. 2005, updated 2006. MODIS mosaic of Antarctica (MOA) image map. Boulder, CO, USA: National Snow and Ice Data Center. Digital media. Available at http://nsidc.org/data/nsidc-0280.html. Background: The MODIS Mosaic of Antarctica (MOA) surface morphology image map is derived from composites of 260 MODIS (Moderate-resolution Imaging Spectroradiometer) orbit swaths acquired between 20 November 2003 and 29 February 2004. The MOA provides a cloud-free view of the ice sheet, ice shelves, and land surfaces. All land areas larger than a few hundred meters that are south of 60 deg S are included in the mosaic, as ell as persistent fast ice regions and some grounded icebergs present near the coast in the 2003-2004 austral summer. The MOA surface morphology image map is derived from digitally processed MODIS Band 1 data: this is viewable here at a grid scale of 125 m and using an ultra-high contrast stretch with minimum and maximum surface brightness values of 15875 and 16125 respectively.
MODIS Mosaic of Antarctica (MOA) Image Map: very high contrast (moa_vhc)
Haran, T., J. Bohlander, T. Scambos, T. Painter, and M. Fahnestock compilers. 2005, updated 2006. MODIS mosaic of Antarctica (MOA) image map. Boulder, CO, USA: National Snow and Ice Data Center. Digital media. Available at http://nsidc.org/data/nsidc-0280.html. Background: The MODIS Mosaic of Antarctica (MOA) surface morphology image map is derived from composites of 260 MODIS (Moderate-resolution Imaging Spectroradiometer) orbit swaths acquired between 20 November 2003 and 29 February 2004. The MOA provides a cloud-free view of the ice sheet, ice shelves, and land surfaces. All land areas larger than a few hundred meters that are south of 60 deg S are included in the mosaic, as ell as persistent fast ice regions and some grounded icebergs present near the coast in the 2003-2004 austral summer. The MOA surface morphology image map is derived from digitally processed MODIS Band 1 data: this is viewable here at a grid scale of 125 m and using a very high contrast stretch with minimum and maximum surface brightness values of 15800 and 16200 respectively.
MODIS Mosaic of Antarctica (MOA) Image Map: high contrast (moa_hc)
Haran, T., J. Bohlander, T. Scambos, T. Painter, and M. Fahnestock compilers. 2005, updated 2006. MODIS mosaic of Antarctica (MOA) image map. Boulder, CO, USA: National Snow and Ice Data Center. Digital media. Available at http://nsidc.org/data/nsidc-0280.html. Background: The MODIS Mosaic of Antarctica (MOA) surface morphology image map is derived from composites of 260 MODIS (Moderate-resolution Imaging Spectroradiometer) orbit swaths acquired between 20 November 2003 and 29 February 2004. The MOA provides a cloud-free view of the ice sheet, ice shelves, and land surfaces. All land areas larger than a few hundred meters that are south of 60 deg S are included in the mosaic, as ell as persistent fast ice regions and some grounded icebergs present near the coast in the 2003-2004 austral summer. The MOA surface morphology image map is derived from digitally processed MODIS Band 1 data: this is viewable here at a grid scale of 125 m and using a high contrast stretch with minimum and maximum surface brightness values of 15500 and 16500 respectively.
MODIS Mosaic of Antarctica (MOA) Image Map: ultra-low contrast (moa_ulc)
Haran, T., J. Bohlander, T. Scambos, T. Painter, and M. Fahnestock compilers. 2005, updated 2006. MODIS mosaic of Antarctica (MOA) image map. Boulder, CO, USA: National Snow and Ice Data Center. Digital media. Available at http://nsidc.org/data/nsidc-0280.html. Background: The MODIS Mosaic of Antarctica (MOA) surface morphology image map is derived from composites of 260 MODIS (Moderate-resolution Imaging Spectroradiometer) orbit swaths acquired between 20 November 2003 and 29 February 2004. The MOA provides a cloud-free view of the ice sheet, ice shelves, and land surfaces. All land areas larger than a few hundred meters that are south of 60 deg S are included in the mosaic, as ell as persistent fast ice regions and some grounded icebergs present near the coast in the 2003-2004 austral summer. The MOA surface morphology image map is derived from digitally processed MODIS Band 1 data: this is viewable here at a grid scale of 125 m and using an ultra-low contrast stretch with minimum and maximum surface brightness values of 1 and 32000 respectively.
MODIS Mosaic of Antarctica (MOA) Image Map: very low contrast (moa_vlc)
Haran, T., J. Bohlander, T. Scambos, T. Painter, and M. Fahnestock compilers. 2005, updated 2006. MODIS mosaic of Antarctica (MOA) image map. Boulder, CO, USA: National Snow and Ice Data Center. Digital media. Available at http://nsidc.org/data/nsidc-0280.html. Background: The MODIS Mosaic of Antarctica (MOA) surface morphology image map is derived from composites of 260 MODIS (Moderate-resolution Imaging Spectroradiometer) orbit swaths acquired between 20 November 2003 and 29 February 2004. The MOA provides a cloud-free view of the ice sheet, ice shelves, and land surfaces. All land areas larger than a few hundred meters that are south of 60 deg S are included in the mosaic, as ell as persistent fast ice regions and some grounded icebergs present near the coast in the 2003-2004 austral summer. The MOA surface morphology image map is derived from digitally processed MODIS Band 1 data: this is viewable here at a grid scale of 125 m and using a very low contrast stretch with minimum and maximum surface brightness values of 9000 and 23000 respectively.
MODIS Mosaic of Antarctica (MOA) Image Map: low contrast (moa_lc)
Haran, T., J. Bohlander, T. Scambos, T. Painter, and M. Fahnestock compilers. 2005, updated 2006. MODIS mosaic of Antarctica (MOA) image map. Boulder, CO, USA: National Snow and Ice Data Center. Digital media. Available at http://nsidc.org/data/nsidc-0280.html. Background: The MODIS Mosaic of Antarctica (MOA) surface morphology image map is derived from composites of 260 MODIS (Moderate-resolution Imaging Spectroradiometer) orbit swaths acquired between 20 November 2003 and 29 February 2004. The MOA provides a cloud-free view of the ice sheet, ice shelves, and land surfaces. All land areas larger than a few hundred meters that are south of 60 deg S are included in the mosaic, as ell as persistent fast ice regions and some grounded icebergs present near the coast in the 2003-2004 austral summer. The MOA surface morphology image map is derived from digitally processed MODIS Band 1 data: this is viewable here at a grid scale of 125 m and using a low contrast stretch with minimum and maximum surface brightness values of 12000 and 20000 respectively.
Satellite Image Map of Antarctica Using Advanced Very High Resolution Radiometer (AVHRR) Images: Band 1: nominal contrast (avhrr_mosaic_band1)
Ferrigno, J.G., J.L. Mullins, J. Stapleton, P.S. Chavez, Jr., M.G. Velasco, R.S. Williams, Jr., G.F. Delinski, Jr., and D. Lear. 1995. Image Data for: Satellite Image Map of Antarctica Using Advanced Very High Resolution Radiometer (AVHRR) Images. Flagstaff, Arizona, USA: United States Geological Survey (USGS). Available at http://terraweb.wr.usgs.gov/TRS/projects/Antarctica/AVHRR.html. Accessed on 09 May 2008. Background: The satellite images used in the mosaic were acquired by the Advanced Very High Resolution Radiometer (AVHRR) sensors on the National Oceanic and Atmospheric Administration (NOAA) satellites; the images used in the mosaic were collected during the period 1980 to 1994. Although the AVHRR scans a 2400 km-wide swath and can image nearly half of the continent of Antarctica on a single orbit, 63 sections of 38 scenes were needed to compile the nearly cloud-free digital mosaic. Band 1 of AVHRR covers the wavelengths of 580 to 680 nm. This mosaic is viewable here using a nominal contrast stretch.
Satellite Image Map of Antarctica Using Advanced Very High Resolution Radiometer (AVHRR) Images: Band 1: very high contrast (avhrr_mosaic_band1_vhc)
Ferrigno, J.G., J.L. Mullins, J. Stapleton, P.S. Chavez, Jr., M.G. Velasco, R.S. Williams, Jr., G.F. Delinski, Jr., and D. Lear. 1995. Image Data for: Satellite Image Map of Antarctica Using Advanced Very High Resolution Radiometer (AVHRR) Images. Flagstaff, Arizona, USA: United States Geological Survey (USGS). Available at http://terraweb.wr.usgs.gov/TRS/projects/Antarctica/AVHRR.html. Accessed on 09 May 2008. Background: The satellite images used in the mosaic were acquired by the Advanced Very High Resolution Radiometer (AVHRR) sensors on the National Oceanic and Atmospheric Administration (NOAA) satellites; the images used in the mosaic were collected during the period 1980 to 1994. Although the AVHRR scans a 2400 km-wide swath and can image nearly half of the continent of Antarctica on a single orbit, 63 sections of 38 scenes were needed to compile the nearly cloud-free digital mosaic. Band 1 of AVHRR covers the wavelengths of 580 to 680 nm. This mosaic is viewable here using a very high contrast stretch.
Satellite Image Map of Antarctica Using Advanced Very High Resolution Radiometer (AVHRR) Images: Band 1: high contrast (avhrr_mosaic_band1_hc)
Ferrigno, J.G., J.L. Mullins, J. Stapleton, P.S. Chavez, Jr., M.G. Velasco, R.S. Williams, Jr., G.F. Delinski, Jr., and D. Lear. 1995. Image Data for: Satellite Image Map of Antarctica Using Advanced Very High Resolution Radiometer (AVHRR) Images. Flagstaff, Arizona, USA: United States Geological Survey (USGS). Available at http://terraweb.wr.usgs.gov/TRS/projects/Antarctica/AVHRR.html. Accessed on 09 May 2008. Background: The satellite images used in the mosaic were acquired by the Advanced Very High Resolution Radiometer (AVHRR) sensors on the National Oceanic and Atmospheric Administration (NOAA) satellites; the images used in the mosaic were collected during the period 1980 to 1994. Although the AVHRR scans a 2400 km-wide swath and can image nearly half of the continent of Antarctica on a single orbit, 63 sections of 38 scenes were needed to compile the nearly cloud-free digital mosaic. Band 1 of AVHRR covers the wavelengths of 580 to 680 nm. This mosaic is viewable here using a high contrast stretch.
Satellite Image Map of Antarctica Using Advanced Very High Resolution Radiometer (AVHRR) Images: Band 1: low contrast (avhrr_mosaic_band1_lc)
Ferrigno, J.G., J.L. Mullins, J. Stapleton, P.S. Chavez, Jr., M.G. Velasco, R.S. Williams, Jr., G.F. Delinski, Jr., and D. Lear. 1995. Image Data for: Satellite Image Map of Antarctica Using Advanced Very High Resolution Radiometer (AVHRR) Images. Flagstaff, Arizona, USA: United States Geological Survey (USGS). Available at http://terraweb.wr.usgs.gov/TRS/projects/Antarctica/AVHRR.html. Accessed on 09 May 2008. Background: The satellite images used in the mosaic were acquired by the Advanced Very High Resolution Radiometer (AVHRR) sensors on the National Oceanic and Atmospheric Administration (NOAA) satellites; the images used in the mosaic were collected during the period 1980 to 1994. Although the AVHRR scans a 2400 km-wide swath and can image nearly half of the continent of Antarctica on a single orbit, 63 sections of 38 scenes were needed to compile the nearly cloud-free digital mosaic. Band 1 of AVHRR covers the wavelengths of 580 to 680 nm. This mosaic is viewable here using a low contrast stretch.
Satellite Image Map of Antarctica Using Advanced Very High Resolution Radiometer (AVHRR) Images: Band 2: nominal contrast (avhrr_mosaic_band2)
Ferrigno, J.G., J.L. Mullins, J. Stapleton, P.S. Chavez, Jr., M.G. Velasco, R.S. Williams, Jr., G.F. Delinski, Jr., and D. Lear. 1995. Image Data for: Satellite Image Map of Antarctica Using Advanced Very High Resolution Radiometer (AVHRR) Images. Flagstaff, Arizona, USA: United States Geological Survey (USGS). Available at http://terraweb.wr.usgs.gov/TRS/projects/Antarctica/AVHRR.html. Accessed on 09 May 2008. Background: The satellite images used in the mosaic were acquired by the Advanced Very High Resolution Radiometer (AVHRR) sensors on the National Oceanic and Atmospheric Administration (NOAA) satellites; the images used in the mosaic were collected during the period 1980 to 1994. Although the AVHRR scans a 2400 km-wide swath and can image nearly half of the continent of Antarctica on a single orbit, 63 sections of 38 scenes were needed to compile the nearly cloud-free digital mosaic. Band 2 of AVHRR covers the wavelengths of 725 to 1100 nm. This mosaic is viewable here using a nominal contrast stretch.
Satellite Image Map of Antarctica Using Advanced Very High Resolution Radiometer (AVHRR) Images: Band 2: very high contrast (avhrr_mosaic_band2_vhc)
Ferrigno, J.G., J.L. Mullins, J. Stapleton, P.S. Chavez, Jr., M.G. Velasco, R.S. Williams, Jr., G.F. Delinski, Jr., and D. Lear. 1995. Image Data for: Satellite Image Map of Antarctica Using Advanced Very High Resolution Radiometer (AVHRR) Images. Flagstaff, Arizona, USA: United States Geological Survey (USGS). Available at http://terraweb.wr.usgs.gov/TRS/projects/Antarctica/AVHRR.html. Accessed on 09 May 2008. Background: The satellite images used in the mosaic were acquired by the Advanced Very High Resolution Radiometer (AVHRR) sensors on the National Oceanic and Atmospheric Administration (NOAA) satellites; the images used in the mosaic were collected during the period 1980 to 1994. Although the AVHRR scans a 2400 km-wide swath and can image nearly half of the continent of Antarctica on a single orbit, 63 sections of 38 scenes were needed to compil e the nearly cloud-free digital mosaic. Band 2 of AVHRR covers the wavelengths of 725 to 1100 nm. This mosaic is viewable here using a very high contrast stretch.
Satellite Image Map of Antarctica Using Advanced Very High Resolution Radiometer (AVHRR) Images: Band 2: high contrast (avhrr_mosaic_band2_hc)
Ferrigno, J.G., J.L. Mullins, J. Stapleton, P.S. Chavez, Jr., M.G. Velasco, R.S. Williams, Jr., G.F. Delinski, Jr., and D. Lear. 1995. Image Data for: Satellite Image Map of Antarctica Using Advanced Very High Resolution Radiometer (AVHRR) Images. Flagstaff, Arizona, USA: United States Geological Survey (USGS). Available at http://terraweb.wr.usgs.gov/TRS/projects/Antarctica/AVHRR.html. Accessed on 09 May 2008. Background: The satellite images used in the mosaic were acquired by the Advanced Very High Resolution Radiometer (AVHRR) sensors on the National Oceanic and Atmospheric Administration (NOAA) satellites; the images used in the mosaic were collected during the period 1980 to 1994. Although the AVHRR scans a 2400 km-wide swath and can image nearly half of the continent of Antarctica on a single orbit, 63 sections of 38 scenes were needed to compile the nearly cloud-free digital mosaic. Band 2 of AVHRR covers the wavelengths of 725 to 1100 nm. This mosaic is viewable here using a high contrast stretch.
Satellite Image Map of Antarctica Using Advanced Very High Resolution Radiometer (AVHRR) Images: Band 2: low contrast (avhrr_mosaic_band2_lc)
Ferrigno, J.G., J.L. Mullins, J. Stapleton, P.S. Chavez, Jr., M.G. Velasco, R.S. Williams, Jr., G.F. Delinski, Jr., and D. Lear. 1995. Image Data for: Satellite Image Map of Antarctica Using Advanced Very High Resolution Radiometer (AVHRR) Images. Flagstaff, Arizona, USA: United States Geological Survey (USGS). Available at http://terraweb.wr.usgs.gov/TRS/projects/Antarctica/AVHRR.html. Accessed on 09 May 2008. Background: The satellite images used in the mosaic were acquired by the Advanced Very High Resolution Radiometer (AVHRR) sensors on the National Oceanic and Atmospheric Administration (NOAA) satellites; the images used in the mosaic were collected during the period 1980 to 1994. Although the AVHRR scans a 2400 km-wide swath and can image nearly half of the continent of Antarctica on a single orbit, 63 sections of 38 scenes were needed to compil e the nearly cloud-free digital mosaic. Band 2 of AVHRR covers the wavelengths of 725 to 1100 nm. This mosaic is viewable here using a low contrast stretch.
RAMP AMM-1 SAR image mosaic of Antarctica: nominal contrast (ramp_sar_mosaic)
Jezek, K. and RAMP Product Team. 2002. RAMP AMM-1 SAR image mosaic of Antarctica. Fairbanks, Alaska USA: Alaska SAR Facility, in association with the National Snow and Ice Data Center, Boulder, Colorado USA. Digital media. Available at http://nsidc.org/data/nsidc-0103.html. Accessed 28 June 2008. Background: In 1997, the Canadian RADARSAT-1 satellite was rotated in orbit, so that its synthetic aperture radar (SAR) antenna looked south towards Antarctica. This permitted the first high-resolution mapping of the entire continent of Antarctica. In eighteen days, the satellite acquired a complete coverage of radar image swaths as part of the first Antarctic Mapping Mission (AMM-1). Swath images have been assembled into an image mosaic depicting the entire continent. Instrument: RADARSAT-1 Synthetic Aperture Radar (SAR). Resolution: 125 m. Frequency/Wavelength: C-Band/5.66 cm. Time Period: September through October 1997. This mosaic is viewable here using a nominal contrast stretch.
RAMP AMM-1 SAR image mosaic of Antarctica: very high contrast (ramp_sar_mosaic_vhc)
Jezek, K. and RAMP Product Team. 2002. RAMP AMM-1 SAR image mosaic of Antarctica. Fairbanks, Alaska USA: Alaska SAR Facility, in association with the National Snow and Ice Data Center, Boulder, Colorado USA. Digital media. Available at http://nsidc.org/data/nsidc-0103.html. Accessed 28 June 2008. Background: In 1997, the Canadian RADARSAT-1 satellite was rotated in orbit, so that its synthetic aperture radar (SAR) antenna looked south towards Antarctica. This permitted the first high-resolution mapping of the entire continent of Antarctica. In eighteen days, the satellite acquired a complete coverage of radar image swaths as part of the first Antarctic Mapping Mission (AMM-1). Swath images have been assembled into an image mosaic depicting the entire continent. Instrument: RADARSAT-1 Synthetic Aperture Radar (SAR). Resolution: 125 m. Frequency/Wavelength: C-Band/5.66 cm. Time Period: September through October 1997. This mosaic is viewable here using a very high contrast stretch.
RAMP AMM-1 SAR image mosaic of Antarctica: high contrast (ramp_sar_mosaic_hc)
Jezek, K. and RAMP Product Team. 2002. RAMP AMM-1 SAR image mosaic of Antarctica. Fairbanks, Alaska USA: Alaska SAR Facility, in association with the National Snow and Ice Data Center, Boulder, Colorado USA. Digital media. Available at http://nsidc.org/data/nsidc-0103.html. Accessed 28 June 2008. Background: In 1997, the Canadian RADARSAT-1 satellite was rotated in orbit, so that its synthetic aperture radar (SAR) antenna looked south towards Antarctica. This permitted the first high-resolution mapping of the entire continent of Antarctica. In eighteen days, the satellite acquired a complete coverage of radar image swaths as part of the first Antarctic Mapping Mission (AMM-1). Swath images have been assembled into an image mosaic depicting the entire continent. Instrument: RADARSAT-1 Synthetic Aperture Radar (SAR). Resolution: 125 m. Frequency/Wavelength: C-Band/5.66 cm. Time Period: September through October 1997. This mosaic is viewable here using a high contrast stretch.
RAMP AMM-1 SAR image mosaic of Antarctica: low contrast (ramp_sar_mosaic_lc)
Jezek, K. and RAMP Product Team. 2002. RAMP AMM-1 SAR image mosaic of Antarctica. Fairbanks, Alaska USA: Alaska SAR Facility, in association with the National Snow and Ice Data Center, Boulder, Colorado USA. Digital media. Available at http://nsidc.org/data/nsidc-0103.html. Accessed 28 June 2008. Background: In 1997, the Canadian RADARSAT-1 satellite was rotated in orbit, so that its synthetic aperture radar (SAR) antenna looked south towards Antarctica. This permitted the first high-resolution mapping of the entire continent of Antarctica. In eighteen days, the satellite acquired a complete coverage of radar image swaths as part of the first Antarctic Mapping Mission (AMM-1). Swath images have been assembled into an image mosaic depicting the entire continent. Instrument: RADARSAT-1 Synthetic Aperture Radar (SAR). Resolution: 125 m. Frequency/Wavelength: C-Band/5.66 cm. Time Period: September through October 1997. This mosaic is viewable here using a low contrast stretch.
RAMP AMM-1 SAR image mosaic of Antarctica: true backscatter (ramp_sar_mosaic_true_backscatter)
Jezek, K. and RAMP Product Team. 2002. RAMP AMM-1 SAR image mosaic of Antarctica. Fairbanks, Alaska USA: Alaska SAR Facility, in association with the National Snow and Ice Data Center, Boulder, Colorado USA. Digital media. Available at http://nsidc.org/data/nsidc-0103.html. Accessed 28 June 2008. Background: In 1997, the Canadian RADARSAT-1 satellite was rotated in orbit, so that its synthetic aperture radar (SAR) antenna looked south towards Antarctica. This permitted the first high-resolution mapping of the entire continent of Antarctica. In eighteen days, the satellite acquired a complete coverage of radar image swaths as part of the first Antarctic Mapping Mission (AMM-1). Swath images have been assembled into an image mosaic depicting the entire continent. Instrument: RADARSAT-1 Synthetic Aperture Radar (SAR). Resolution: 125 m. Frequency/Wavelength: C-Band/5.66 cm. Time Period: September through October 1997. This mosaic is viewable here with its true backscatter values (sigma-naught), ranging from -30.000610 dB to 9.999390 dB.
DISP image mosaic of coastal Antarctica: nominal contrast (disp_mosaic)
Kim, K., K. Jezek, and H. Lui. 2006. DISP image mosaic of coastal Antarctica. Columbus, Ohio USA: Byrd Polar Research Center, Remote Sensing Laboratory. Digital Media. Available at http://bprc.osu.edu/rsl/index_files/BPRCData.htm. Accessed 09 May 2008. Background: This mosaic of coastal Antarctica was compiled from U.S. Declassified Intelligence Satellite Photographs (DISP) at 100 m resolution from the time period 29 August - 03 November 1963. This mosaic is viewable here using a nominal contrast stretch.
DISP image mosaic of coastal Antarctica: very high contrast (disp_mosaic_vhc)
Kim, K., K. Jezek, and H. Lui. 2006. DISP image mosaic of coastal Antarctica. Columbus, Ohio USA: Byrd Polar Research Center, Remote Sensing Laboratory. Digital Media. Available at http://bprc.osu.edu/rsl/index_files/BPRCData.htm. Accessed 09 May 2008. Background: This mosaic of coastal Antarctica was compiled from U.S. Declassified Intelligence Satellite Photographs (DISP) at 100 m resolution from the time period 29 August - 03 November 1963. This mosaic is viewable here using a very high contrast stretch.
DISP image mosaic of coastal Antarctica: high contrast (disp_mosaic_hc)
Kim, K., K. Jezek, and H. Lui. 2006. DISP image mosaic of coastal Antarctica. Columbus, Ohio USA: Byrd Polar Research Center, Remote Sensing Laboratory. Digital Media. Available at http://bprc.osu.edu/rsl/index_files/BPRCData.htm. Accessed 09 May 2008. Background: This mosaic of coastal Antarctica was compiled from U.S. Declassified Intelligence Satellite Photographs (DISP) at 100 m resolution from the time period 29 August - 03 November 1963. This mosaic is viewable here using a high contrast stretch.
DISP image mosaic of coastal Antarctica: low contrast (disp_mosaic_lc)
Kim, K., K. Jezek, and H. Lui. 2006. DISP image mosaic of coastal Antarctica. Columbus, Ohio USA: Byrd Polar Research Center, Remote Sensing Laboratory. Digital Media. Available at http://bprc.osu.edu/rsl/index_files/BPRCData.htm. Accessed 09 May 2008. Background: This mosaic of coastal Antarctica was compiled from U.S. Declassified Intelligence Satellite Photographs (DISP) at 100 m resolution from the time period 29 August - 03 November 1963. This mosaic is viewable here using a low contrast stretch.
BEDMAP - bed topography of the Antarctic: nominal contrast (bedmap)
Lythe, M. B., D. G. Vaughan, and the BEDMAP Consortium. 2000. BEDMAP - bed topography of the Antarctic. Cambridge, United Kingdom: British Antarctic Survey. Digital Media. Available at http://www.antarctica.ac.uk//bas_research/data/access/bedmap/. Accessed 28 June 2008. Background: The BEDMAP project was conceived as an attempt to rationalise the coverage of ice thickness measurements over Antarctica, collect the data together and produce a new topographic model of the bed of the Antarctic Ice Sheet, to provide a new basis for all aspects of Antarctic geoscience. Includes the entire area south of 60 degrees south latitude. Resolution: 5 km. Time Period: 1951-1999. Sources: ground-based and airborne surveys, primarily from radar and seismic sounding as well as gravimetric measurements. Elevations are relative to the OSU91A geoid. This map is viewable here using a nominal contrast stretch with minimum and maximum elevations (m) of -2500 and 3600 respectively.
BEDMAP - bed topography of the Antarctic: high contrast (bedmap_hc)
Lythe, M. B., D. G. Vaughan, and the BEDMAP Consortium. 2000. BEDMAP - bed topography of the Antarctic. Cambridge, United Kingdom: British Antarctic Survey. Digital Media. Available at http://www.antarctica.ac.uk//bas_research/data/access/bedmap/. Accessed 28 June 2008. Background: The BEDMAP project was conceived as an attempt to rationalise the coverage of ice thickness measurements over Antarctica, collect the data together and produce a new topographic model of the bed of the Antarctic Ice Sheet, to provide a new basis for all aspects of Antarctic geoscience. Includes the entire area south of 60 degrees south latitude. Resolution: 5 km. Time Period: 1951-1999. Sources: ground-based and airborne surveys, primarily from radar and seismic sounding as well as gravimetric measurements. Elevations are relative to the OSU91A geoid. This map is viewable here using a high contrast stretch with minimum and maximum elevations (m) of -900 and 2200 respectively.
BEDMAP - bed topography of the Antarctic: low contrast (bedmap_lc)
Lythe, M. B., D. G. Vaughan, and the BEDMAP Consortium. 2000. BEDMAP - bed topography of the Antarctic. Cambridge, United Kingdom: British Antarctic Survey. Digital Media. Available at http://www.antarctica.ac.uk//bas_research/data/access/bedmap/. Accessed 28 June 2008. Background: The BEDMAP project was conceived as an attempt to rationalise the coverage of ice thickness measurements over Antarctica, collect the data together and produce a new topographic model of the bed of the Antarctic Ice Sheet, to provide a new basis for all aspects of Antarctic geoscience. Includes the entire area south of 60 degrees south latitude. Resolution: 5 km. Time Period: 1951-1999. Sources: ground-based and airborne surveys, primarily from radar and seismic sounding as well as gravimetric measurements. Elevations are relative to the OSU91A geoid. This map is viewable here using a low contrast stretch with minimum and maximum elevations (m) of -6887 and 4364 respectively.
BEDMAP - bed topography of the Antarctic: graded (bedmap_graded)
Lythe, M. B., D. G. Vaughan, and the BEDMAP Consortium. 2000. BEDMAP - bed topography of the Antarctic. Cambridge, United Kingdom: British Antarctic Survey. Digital Media. Available at http://www.antarctica.ac.uk//bas_research/data/access/bedmap/. Accessed 28 June 2008. Background: The BEDMAP project was conceived as an attempt to rationalise the coverage of ice thickness measurements over Antarctica, collect the data together and produce a new topographic model of the bed of the Antarctic Ice Sheet, to provide a new basis for all aspects of Antarctic geoscience. Includes the entire area south of 60 degrees south latitude. Resolution: 5 km. Time Period: 1951-1999. Sources: ground-based and airborne surveys, primarily from radar and seismic sounding as well as gravimetric measurements. Elevations are relative to the OSU91A geoid.
Antarctic 5-km digital elevation model from ERS-1 altimetry: nominal contrast (bamber_dem)
Bamber, J. L. and R. A. Bindschadler. 1997. An improved elevation dataset for climate and ice-sheet modelling: validation with satellite imagery. Annals of Glaciology 25:438-444.; Bamber, J. L. and R. A. Bindschadler. 1997. Antarctic 5-km digital elevation model from ERS-1 altimetry. Boulder, Colorado USA: National Snow and Ice Data Center. Digital Media. Available at http://nsidc.org/data/nsidc-0076.html. Accessed 03 July 2008. Background: This data set provides a digital elevation model (DEM) for Antarctica to 81.5 degrees south latitude, at a resolution of 5 km. Approximately twenty million data points were used to generate this data set. Data points were derived from European Remote Sensing Satellite-1 (ERS-1) radar altimetry during the geodetic phase from March 1994 to May 1995. The improved density in coverage and resolution, compared with past satellite altimetry missions, provides better detection of topographic detail such as surface undulations, ice streams, grounding zones, and interstream ridges. This DEM is viewable here using a nominal contrast stretch with minimum and maximum OSU91A elevations (m) of 0 and 3600 respectively.
Antarctic 5-km digital elevation model from ERS-1 altimetry: ultra-high contrast (bamber_dem_uhc)
Bamber, J. L. and R. A. Bindschadler. 1997. An improved elevation dataset for climate and ice-sheet modelling: validation with satellite imagery. Annals of Glaciology 25:438-444.; Bamber, J. L. and R. A. Bindschadler. 1997. Antarctic 5-km digital elevation model from ERS-1 altimetry. Boulder, Colorado USA: National Snow and Ice Data Center. Digital Media. Available at http://nsidc.org/data/nsidc-0076.html. Accessed 03 July 2008. Background: This data set provides a digital elevation model (DEM) for Antarctica to 81.5 degrees south latitude, at a resolution of 5 km. Approximately twenty million data points were used to generate this data set. Data points were derived from European Remote Sensing Satellite-1 (ERS-1) radar altimetry during the geodetic phase from March 1994 to May 1995. The improved density in coverage and resolution, compared with past satellite altimetry missions, provides better detection of topographic detail such as surface undulations, ice streams, grounding zones, and interstream ridges. This DEM is viewable here using an ultra-high contrast stretch with minimum and maximum OSU91A elevations (m) of 0 and 100 respectively.
Antarctic 5-km digital elevation model from ERS-1 altimetry: very high contrast (bamber_dem_vhc)
Bamber, J. L. and R. A. Bindschadler. 1997. An improved elevation dataset for climate and ice-sheet modelling: validation with satellite imagery. Annals of Glaciology 25:438-444.; Bamber, J. L. and R. A. Bindschadler. 1997. Antarctic 5-km digital elevation model from ERS-1 altimetry. Boulder, Colorado USA: National Snow and Ice Data Center. Digital Media. Available at http://nsidc.org/data/nsidc-0076.html. Accessed 03 July 2008. Background: This data set provides a digital elevation model (DEM) for Antarctica to 81.5 degrees south latitude, at a resolution of 5 km. Approximately twenty million data points were used to generate this data set. Data points were derived from European Remote Sensing Satellite-1 (ERS-1) radar altimetry during the geodetic phase from March 1994 to May 1995. The improved density in coverage and resolution, compared with past satellite altimetry missions, provides better detection of topographic detail such as surface undulations, ice streams, grounding zones, and interstream ridges. This DEM is viewable here using a very high contrast stretch with minimum and maximum OSU91A elevations (m) of 0 and 1000 respectively.
Antarctic 5-km digital elevation model from ERS-1 altimetry: high contrast (bamber_dem_hc)
Bamber, J. L. and R. A. Bindschadler. 1997. An improved elevation dataset for climate and ice-sheet modelling: validation with satellite imagery. Annals of Glaciology 25:438-444.; Bamber, J. L. and R. A. Bindschadler. 1997. Antarctic 5-km digital elevation model from ERS-1 altimetry. Boulder, Colorado USA: National Snow and Ice Data Center. Digital Media. Available at http://nsidc.org/data/nsidc-0076.html. Accessed 03 July 2008. Background: This data set provides a digital elevation model (DEM) for Antarctica to 81.5 degrees south latitude, at a resolution of 5 km. Approximately twenty million data points were used to generate this data set. Data points were derived from European Remote Sensing Satellite-1 (ERS-1) radar altimetry during the geodetic phase from March 1994 to May 1995. The improved density in coverage and resolution, compared with past satellite altimetry missions, provides better detection of topographic detail such as surface undulations, ice streams, grounding zones, and interstream ridges. This DEM is viewable here using a high contrast stretch with minimum and maximum OSU91A elevations (m) of 0 and 2000 respectively.
Antarctic 5-km digital elevation model from ERS-1 altimetry: low contrast (bamber_dem_lc)
Bamber, J. L. and R. A. Bindschadler. 1997. An improved elevation dataset for climate and ice-sheet modelling: validation with satellite imagery. Annals of Glaciology 25:438-444.; Bamber, J. L. and R. A. Bindschadler. 1997. Antarctic 5-km digital elevation model from ERS-1 altimetry. Boulder, Colorado USA: National Snow and Ice Data Center. Digital Media. Available at http://nsidc.org/data/nsidc-0076.html. Accessed 03 July 2008. Background: This data set provides a digital elevation model (DEM) for Antarctica to 81.5 degrees south latitude, at a resolution of 5 km. Approximately twenty million data points were used to generate this data set. Data points were derived from European Remote Sensing Satellite-1 (ERS-1) radar altimetry during the geodetic phase from March 1994 to May 1995. The improved density in coverage and resolution, compared with past satellite altimetry missions, provides better detection of topographic detail such as surface undulations, ice streams, grounding zones, and interstream ridges. This DEM is viewable here using a low contrast stretch with minimum and maximum OSU91A elevations (m) of 0 and 5675 respectively.
Antarctic 5-km digital elevation model from ERS-1 altimetry: graded (bamber_dem_graded)
Bamber, J. L. and R. A. Bindschadler. 1997. An improved elevation dataset for climate and ice-sheet modelling: validation with satellite imagery. Annals of Glaciology 25:438-444.; Bamber, J. L. and R. A. Bindschadler. 1997. Antarctic 5-km digital elevation model from ERS-1 altimetry. Boulder, Colorado USA: National Snow and Ice Data Center. Digital Media. Available at http://nsidc.org/data/nsidc-0076.html. Accessed 03 July 2008. Background: This data set provides a digital elevation model (DEM) for Antarctica to 81.5 degrees south latitude, at a resolution of 5 km. Approximately twenty million data points were used to generate this data set. Data points were derived from European Remote Sensing Satellite-1 (ERS-1) radar altimetry during the geodetic phase from March 1994 to May 1995. The improved density in coverage and resolution, compared with past satellite altimetry missions, provides better detection of topographic detail such as surface undulations, ice streams, grounding zones, and interstream ridges.
GLAS/ICESat 500 m laser altimetry digital elevation model of Antarctica: nominal contrast (glas_dem)
DiMarzio, J., A. Brenner, R. Schutz, C. A. Shuman, and H. J. Zwally. 2007. GLAS/ICESat 500 m laser altimetry digital elevation model of Antarctica. Boulder, Colorado USA: National Snow and Ice Data Center. Digital media. Available at http://nsidc.org/data/nsidc-0304.html. Accessed 03 July 2008. Background: This digital elevation model (DEM) of Antarctica is derived from Geoscience Laser Altimeter System (GLAS)/Ice, Cloud, and land Elevation Satellite (ICESat) laser altimetry profile data and provides new surface elevation grids of the ice sheets and coastal areas, with greater latitudinal extent and fewer slope-related effects than radar altimetry. This DEM is generated from the first seven operational periods (from February 2003 through June 2005) of the GLAS instrument. The grid is provided at 500 m spacing and covers all of Antarctica north of 86 degrees S. Elevations are reported as centimeters above the WGS84 ellipsoid. This DEM is viewable here using a nominal contrast stretch with minimum and maximum WGS84 elevations (cm) of 1 and 360000 respectively.
GLAS/ICESat 500 m laser altimetry digital elevation model of Antarctica: ultra-high contrast (glas_dem_uhc)
DiMarzio, J., A. Brenner, R. Schutz, C. A. Shuman, and H. J. Zwally. 2007. GLAS/ICESat 500 m laser altimetry digital elevation model of Antarctica. Boulder, Colorado USA: National Snow and Ice Data Center. Digital media. Available at http://nsidc.org/data/nsidc-0304.html. Accessed 03 July 2008. Background: This digital elevation model (DEM) of Antarctica is derived from Geoscience Laser Altimeter System (GLAS)/Ice, Cloud, and land Elevation Satellite (ICESat) laser altimetry profile data and provides new surface elevation grids of the ice sheets and coastal areas, with greater latitudinal extent and fewer slope-related effects than radar altimetry. This DEM is generated from the first seven operational periods (from February 2003 through June 2005) of the GLAS instrument. The grid is provided at 500 m spacing and covers all of Antarctica north of 86 degrees S. Elevations are reported as centimeters above the WGS84 ellipsoid. This DEM is viewable here using an ultra-high contrast stretch with minimum and maximum WGS84 elevations (cm) of 1 and 10000 respectively.
GLAS/ICESat 500 m laser altimetry digital elevation model of Antarctica: very high contrast (glas_dem_vhc)
DiMarzio, J., A. Brenner, R. Schutz, C. A. Shuman, and H. J. Zwally. 2007. GLAS/ICESat 500 m laser altimetry digital elevation model of Antarctica. Boulder, Colorado USA: National Snow and Ice Data Center. Digital media. Available at http://nsidc.org/data/nsidc-0304.html. Accessed 03 July 2008. Background: This digital elevation model (DEM) of Antarctica is derived from Geoscience Laser Altimeter System (GLAS)/Ice, Cloud, and land Elevation Satellite (ICESat) laser altimetry profile data and provides new surface elevation grids of the ice sheets and coastal areas, with greater latitudinal extent and fewer slope-related effects than radar altimetry. This DEM is generated from the first seven operational periods (from February 2003 through June 2005) of the GLAS instrument. The grid is provided at 500 m spacing and covers all of Antarctica north of 86 degrees S. Elevations are reported as centimeters above the WGS84 ellipsoid. This DEM is viewable here using a very high contrast stretch with minimum and maximum WGS84 elevations (cm) of 1 and 100000 respectively.
GLAS/ICESat 500 m laser altimetry digital elevation model of Antarctica: high contrast (glas_dem_hc)
DiMarzio, J., A. Brenner, R. Schutz, C. A. Shuman, and H. J. Zwally. 2007. GLAS/ICESat 500 m laser altimetry digital elevation model of Antarctica. Boulder, Colorado USA: National Snow and Ice Data Center. Digital media. Available at http://nsidc.org/data/nsidc-0304.html. Accessed 03 July 2008. Background: This digital elevation model (DEM) of Antarctica is derived from Geoscience Laser Altimeter System (GLAS)/Ice, Cloud, and land Elevation Satellite (ICESat) laser altimetry profile data and provides new surface elevation grids of the ice sheets and coastal areas, with greater latitudinal extent and fewer slope-related effects than radar altimetry. This DEM is generated from the first seven operational periods (from February 2003 through June 2005) of the GLAS instrument. The grid is provided at 500 m spacing and covers all of Antarctica north of 86 degrees S. Elevations are reported as centimeters above the WGS84 ellipsoid. This DEM is viewable here using a high contrast stretch with minimum and maximum WGS84 elevations (cm) of 1 and 200000 respectively.
GLAS/ICESat 500 m laser altimetry digital elevation model of Antarctica: low contrast (glas_dem_lc)
DiMarzio, J., A. Brenner, R. Schutz, C. A. Shuman, and H. J. Zwally. 2007. GLAS/ICESat 500 m laser altimetry digital elevation model of Antarctica. Boulder, Colorado USA: National Snow and Ice Data Center. Digital media. Available at http://nsidc.org/data/nsidc-0304.html. Accessed 03 July 2008. Background: This digital elevation model (DEM) of Antarctica is derived from Geoscience Laser Altimeter System (GLAS)/Ice, Cloud, and land Elevation Satellite (ICESat) laser altimetry profile data and provides new surface elevation grids of the ice sheets and coastal areas, with greater latitudinal extent and fewer slope-related effects than radar altimetry. This DEM is generated from the first seven operational periods (from February 2003 through June 2005) of the GLAS instrument. The grid is provided at 500 m spacing and covers all of Antarctica north of 86 degrees S. Elevations are reported as centimeters above the WGS84 ellipsoid. This DEM is viewable here using a nominal contrast stretch with minimum and maximum WGS84 elevations (cm) of 1 and 500000 respectively.
GLAS/ICESat 500 m laser altimetry digital elevation model of Antarctica: graded (glas_dem_graded)
DiMarzio, J., A. Brenner, R. Schutz, C. A. Shuman, and H. J. Zwally. 2007. GLAS/ICESat 500 m laser altimetry digital elevation model of Antarctica. Boulder, Colorado USA: National Snow and Ice Data Center. Digital media. Available at http://nsidc.org/data/nsidc-0304.html. Accessed 03 July 2008. Background: This digital elevation model (DEM) of Antarctica is derived from Geoscience Laser Altimeter System (GLAS)/Ice, Cloud, and land Elevation Satellite (ICESat) laser altimetry profile data and provides new surface elevation grids of the ice sheets and coastal areas, with greater latitudinal extent and fewer slope-related effects than radar altimetry. This DEM is generated from the first seven operational periods (from February 2003 through June 2005) of the GLAS instrument. The grid is provided at 500 m spacing and covers all of Antarctica north of 86 degrees S. Elevations are reported as centimeters above the WGS84 ellipsoid.
Radarsat Antarctic Mapping Project digital elevation model version 2: nominal contrast (ramp_dem)
Liu, H., K. Jezek, B. Li, and Z. Zhao. 2001. Radarsat Antarctic Mapping Project digital elevation model version 2. Boulder, CO, USA: National Snow and Ice Data Center. Digital media. Available at http://nsidc.org/data/nsidc-0082.html. Accessed on 06 June 2008. Background: The high-resolution (200 m) Radarsat Antarctic Mapping Project (RAMP) Digital Elevation Model (DEM) combines topographic data from a variety of sources to provide consistent coverage of all of Antarctica. Version 2 improves upon the original version by incorporating new topographic data, error corrections, extended coverage, and other modifications. The DEM incorporates topographic data from satellite radar altimetry, airborne radar surveys, the recently-updated Antarctic Digital Database (version 2), and large-scale topographic maps from the U.S. Geological Survey (USGS) and the Australian Antarctic Division. Data were collected between the 1940s and present, with most collected during the 1980s and 1990s. Although the RAMP DEM was created to aid in processing RAMP radar data, it does not utilize any RAMP radar data. This DEM is viewable here at a grid scale of 200 m and using a nominal contrast stretch with minimum and maximum WGS84 elevations (m) of -67 and 3600 respectively.
Radarsat Antarctic Mapping Project digital elevation model version 2: ultra-high contrast (ramp_dem_uhc)
Liu, H., K. Jezek, B. Li, and Z. Zhao. 2001. Radarsat Antarctic Mapping Project digital elevation model version 2. Boulder, CO, USA: National Snow and Ice Data Center. Digital media. Available at http://nsidc.org/data/nsidc-0082.html. Accessed on 06 June 2008. Background: The high-resolution (200 m) Radarsat Antarctic Mapping Project (RAMP) Digital Elevation Model (DEM) combines topographic data from a variety of sources to provide consistent coverage of all of Antarctica. Version 2 improves upon the original version by incorporating new topographic data, error corrections, extended coverage, and other modifications. The DEM incorporates topographic data from satellite radar altimetry, airborne radar surveys, the recently-updated Antarctic Digital Database (version 2), and large-scale topographic maps from the U.S. Geological Survey (USGS) and the Australian Antarctic Division. Data were collected between the 1940s and present, with most collected during the 1980s and 1990s. Although the RAMP DEM was created to aid in processing RAMP radar data, it does not utilize any RAMP radar data. This DEM is viewable here at a grid scale of 200 m and using an ultra-high contrast stretch with minimum and maximum WGS84 elevations (m) of -67 and 100 respectively.
Radarsat Antarctic Mapping Project digital elevation model version 2: very high contrast (ramp_dem_vhc)
Liu, H., K. Jezek, B. Li, and Z. Zhao. 2001. Radarsat Antarctic Mapping Project digital elevation model version 2. Boulder, CO, USA: National Snow and Ice Data Center. Digital media. Available at http://nsidc.org/data/nsidc-0082.html. Accessed on 06 June 2008. Background: The high-resolution (200 m) Radarsat Antarctic Mapping Project (RAMP) Digital Elevation Model (DEM) combines topographic data from a variety of sources to provide consistent coverage of all of Antarctica. Version 2 improves upon the original version by incorporating new topographic data, error corrections, extended coverage, and other modifications. The DEM incorporates topographic data from satellite radar altimetry, airborne radar surveys, the recently-updated Antarctic Digital Database (version 2), and large-scale topographic maps from the U.S. Geological Survey (USGS) and the Australian Antarctic Division. Data were collected between the 1940s and present, with most collected during the 1980s and 1990s. Although the RAMP DEM was created to aid in processing RAMP radar data, it does not utilize any RAMP radar data. This DEM is viewable here at a grid scale of 200 m and using a very high contrast stretch with minimum and maximum WGS84 elevations (m) of -67 and 1000 respectively.
Radarsat Antarctic Mapping Project digital elevation model version 2: high contrast (ramp_dem_hc)
Liu, H., K. Jezek, B. Li, and Z. Zhao. 2001. Radarsat Antarctic Mapping Project digital elevation model version 2. Boulder, CO, USA: National Snow and Ice Data Center. Digital media. Available at http://nsidc.org/data/nsidc-0082.html. Accessed on 06 June 2008. Background: The high-resolution (200 m) Radarsat Antarctic Mapping Project (RAMP) Digital Elevation Model (DEM) combines topographic data from a variety of sources to provide consistent coverage of all of Antarctica. Version 2 improves upon the original version by incorporating new topographic data, error corrections, extended coverage, and other modifications. The DEM incorporates topographic data from satellite radar altimetry, airborne radar surveys, the recently-updated Antarctic Digital Database (version 2), and large-scale topographic maps from the U.S. Geological Survey (USGS) and the Australian Antarctic Division. Data were collected between the 1940s and present, with most collected during the 1980s and 1990s. Although the RAMP DEM was created to aid in processing RAMP radar data, it does not utilize any RAMP radar data. This DEM is viewable here at a grid scale of 200 m and using a high contrast stretch with minimum and maximum WGS84 elevations (m) of -67 and 2000 respectively.
Radarsat Antarctic Mapping Project digital elevation model version 2: low contrast (ramp_dem_lc)
Liu, H., K. Jezek, B. Li, and Z. Zhao. 2001. Radarsat Antarctic Mapping Project digital elevation model version 2. Boulder, CO, USA: National Snow and Ice Data Center. Digital media. Available at http://nsidc.org/data/nsidc-0082.html. Accessed on 06 June 2008. Background: The high-resolution (200 m) Radarsat Antarctic Mapping Project (RAMP) Digital Elevation Model (DEM) combines topographic data from a variety of sources to provide consistent coverage of all of Antarctica. Version 2 improves upon the original version by incorporating new topographic data, error corrections, extended coverage, and other modifications. The DEM incorporates topographic data from satellite radar altimetry, airborne radar surveys, the recently-updated Antarctic Digital Database (version 2), and large-scale topographic maps from the U.S. Geological Survey (USGS) and the Australian Antarctic Division. Data were collected between the 1940s and present, with most collected during the 1980s and 1990s. Although the RAMP DEM was created to aid in processing RAMP radar data, it does not utilize any RAMP radar data. This DEM is viewable here at a grid scale of 200 m and using a low contrast stretch with minimum and maximum WGS84 elevations (m) of -67 and 5008 respectively.
ramp_dem_graded (ramp_dem_graded)
ramp_dem_graded
Antarctic ice shelves (ramp_dem_graded_below_100m)
Bohlander, J. and T. Scambos. 2007. Antarctic coastlines and grounding line derived from MODIS Mosaic of Antarctica (MOA). Boulder, Colorado USA: National Snow and Ice Data Center. Digital media. Accessed 24 April 2008. Background: These outlines were hand-digitized from the Moderate-resolution Imaging Spectroradiometer (MODIS) mosaic of Antarctica (MOA) image map produced and distributed by the National Snow and Ice Data Center (NSIDC) at: http://nsidc.org/data/nsidc-0280.html. The coastline includes the ice shelves surrounding Antarctica while the grounding line excludes them. Coastlines for islands surrounding Antarctica are provided separately from the rest of Antarctica's grounding line.
Radarsat Antarctic Mapping Project digital elevation model version 2: graded (ramp_dem_graded_above_100m)
Liu, H., K. Jezek, B. Li, and Z. Zhao. 2001. Radarsat Antarctic Mapping Project digital elevation model version 2. Boulder, CO, USA: National Snow and Ice Data Center. Digital media. Available at http://nsidc.org/data/nsidc-0082.html. Accessed on 06 June 2008. Background: The high-resolution (200 m) Radarsat Antarctic Mapping Project (RAMP) Digital Elevation Model (DEM) combines topographic data from a variety of sources to provide consistent coverage of all of Antarctica. Version 2 improves upon the original version by incorporating new topographic data, error corrections, extended coverage, and other modifications. The DEM incorporates topographic data from satellite radar altimetry, airborne radar surveys, the recently-updated Antarctic Digital Database (version 2), and large-scale topographic maps from the U.S. Geological Survey (USGS) and the Australian Antarctic Division. Data were collected between the 1940s and present, with most collected during the 1980s and 1990s. Although the RAMP DEM was created to aid in processing RAMP radar data, it does not utilize any RAMP radar data. This DEM is viewable here at a grid scale of 200 m and elevations are reported relative to the WGS84 ellipsoid.
Antarctic snow accumulation: Arthern et al. 2006 (accumulation_arthern)
Arthern, R. J., D. P. Winebrenner, and D. G. Vaughan. 2006. Antarctic snow accumulation mapped using polarization of 4.3-cm wavelength microwave emission. Journal of Geophysical Research. 111, D06107, doi:10.1029/2004JD005667. Data provided by the British Antarctic Survery, Cambridge, United Kingdom. Available at http://www.antarctica.ac.uk//bas_research/data/online_resources/snow_accumulation/. Accessed 27 October 2006. Background: This map of Antarctic snow accumulation is derived from a compilation of field measurements. Satellite observations from AMSR-E and AVHRR are used to guide the interpolation. Values for locations subject to snow melt may be unreliable. From this map can be obtained a value of 143 +/- 4 mm per year snow water equivalent for the average rate of snow accumulation upon the grounded ice sheet of Antarctica. Resolution: 125 km.
Antarctic snow accumulation: Arthern et al. 2006 (graded map) (accumulation_arthern_graded)
Arthern, R. J., D. P. Winebrenner, and D. G. Vaughan. 2006. Antarctic snow accumulation mapped using polarization of 4.3-cm wavelength microwave emission. Journal of Geophysical Research. 111, D06107, doi:10.1029/2004JD005667. Data provided by the British Antarctic Survery, Cambridge, United Kingdom. Available at http://www.antarctica.ac.uk//bas_research/data/online_resources/snow_accumulation/. Accessed 27 October 2006. Background: This map of Antarctic snow accumulation is derived from a compilation of field measurements. Satellite observations from AMSR-E and AVHRR are used to guide the interpolation. Values for locations subject to snow melt may be unreliable. From this map can be obtained a value of 143 +/- 4 mm per year snow water equivalent for the average rate of snow accumulation upon the grounded ice sheet of Antarctica. Resolution: 125 km.
Antarctic snow accumulation: Monaghan et al. 2006 (accumulation_monaghan)
Monaghan, A. J., D. H. Bromwich, and S.-H. Wang. 2006. Recent trends in Antarctic snow accumulation from Polar MM5 simulations. Philisophical Transactions of the Royal Society A 364: 1683-1708. Data provided by the Ohio State University, Byrd Polar Research Center, Polar Meteorology Group, Columbus, Ohio USA. Available at http://polarmet.mps.ohio-state.edu/PolarMet/ant_hindcast.html. Accessed 10 August 2008. Background: Polar MM5, a mesoscale atmospheric model optimized for use over polar ice sheets, is employed to simulate Antarctic accumulation in recent decades by subtracting model-simulated precipitation from sublimation. Negative values therefore indicate areas where sublimation is greater than precipitation. Resolution: 60 km.
Antarctic snow accumulation: Monaghan et al. 2006 (graded map) (accumulation_monaghan_graded)
Monaghan, A. J., D. H. Bromwich, and S.-H. Wang. 2006. Recent trends in Antarctic snow accumulation from Polar MM5 simulations. Philisophical Transactions of the Royal Society A 364: 1683-1708. Data provided by the Ohio State University, Byrd Polar Research Center, Polar Meteorology Group, Columbus, Ohio USA. Available at http://polarmet.mps.ohio-state.edu/PolarMet/ant_hindcast.html. Accessed 10 August 2008. Background: Polar MM5, a mesoscale atmospheric model optimized for use over polar ice sheets, is employed to simulate Antarctic accumulation in recent decades by subtracting model-simulated precipitation from sublimation. Negative values therefore indicate areas where sublimation is greater than precipitation. Resolution: 60 km.
Antarctic surface mass balance: Van de Berg et al. 2005 (surface_mass_balance_van_de_berg)
Van de Berg, W. J., M. R. van den Broeke, C. H. Reijmer, and E. van Meijgaard. 2005. Characteristics of the Antarctic surface mass balance, 1958-2002, using a regional atmospheric climate model. Annals of Glaciology 41:97-104. Data provided by Utrecht University, Utrecht, Netherlands. Accessed 10 August 2008. Background: Regional Atmospheric Climate Model version 2 (RACMO2/ANT) simulations with initial and boundary conditions provided by the European Centre for Medium-Range Weather Forecasts (ECMWF) 40-year Reanalysis (ERA-40). Resolution: 60 km. Time Period: 1958-2002. RACMO2/ANT is employed to simulate Antarctic specific surface mass balance (SSMB) in recent decades as the sum of modeled solid precipitation, sublimation/deposition, and melt.
Antarctic surface mass balance: Van de Berg et al. 2005 (graded) (surface_mass_balance_van_de_berg_graded)
Van de Berg, W. J., M. R. van den Broeke, C. H. Reijmer, and E. van Meijgaard. 2005. Characteristics of the Antarctic surface mass balance, 1958-2002, using a regional atmospheric climate model. Annals of Glaciology 41:97-104. Data provided by Utrecht University, Utrecht, Netherlands. Accessed 10 August 2008. Background: Regional Atmospheric Climate Model version 2 (RACMO2/ANT) simulations with initial and boundary conditions provided by the European Centre for Medium-Range Weather Forecasts (ECMWF) 40-year Reanalysis (ERA-40). Resolution: 60 km. Time Period: 1958-2002. RACMO2/ANT is employed to simulate Antarctic specific surface mass balance (SSMB) in recent decades as the sum of modeled solid precipitation, sublimation/deposition, and melt.
Ice thickness and surface elevation, southeastern Ross Embayment, West Antarctica: surface elevation (nsidc-0099.elevation)
Blankenship, D. D., D. L. Morse, C. A. Finn, R. E. Bell, M. E. Peters, S. D. Kempf, et al. 2001. Ice thickness and surface elevation, southeastern Ross Embayment, West Antarctica. Boulder, Colorado USA: National Snow and Ice Data Center. Digital media. Available at http://nsidc.org/data/nsidc-0099.html. Accessed 05 December 2008. Background: Ice surface elevation and ice thickness data are available for a portion of the West Antarctic Ice Sheet. The investigators utilized a laser altimeter and ice-penetrating radar mounted to a Twin Otter aircraft to survey the ice sheet. These data are a result of the Corridor Aerogeophysics of the Southeastern Ross Transect Zone (CASERTZ) experiments of the 1990s. The CASERTZ geophysical surveys were aimed at understanding geological controls on ice streams of the West Antarctic Ice Sheet, ultimately to help assess the potential for ice sheet collapse. Time period: 1991/92, 1992/93, and 1995/96. Flight tracks: 116. Sample points: 53,170. Spacing: ~8 m. Units: m (vs. WGS84 ellipsoid).
Ice thickness and surface elevation, southeastern Ross Embayment, West Antarctica: ice thickness (nsidc-0099.ice_thickness)
Blankenship, D. D., D. L. Morse, C. A. Finn, R. E. Bell, M. E. Peters, S. D. Kempf, et al. 2001. Ice thickness and surface elevation, southeastern Ross Embayment, West Antarctica. Boulder, Colorado USA: National Snow and Ice Data Center. Digital media. Available at http://nsidc.org/data/nsidc-0099.html. Accessed 05 December 2008. Background: Ice surface elevation and ice thickness data are available for a portion of the West Antarctic Ice Sheet. The investigators utilized a laser altimeter and ice-penetrating radar mounted to a Twin Otter aircraft to survey the ice sheet. These data are a result of the Corridor Aerogeophysics of the Southeastern Ross Transect Zone (CASERTZ) experiments of the 1990s. The CASERTZ geophysical surveys were aimed at understanding geological controls on ice streams of the West Antarctic Ice Sheet, ultimately to help assess the potential for ice sheet collapse. Time period: 1991/92, 1992/93, and 1995/96. Flight tracks: 116. Sample points: 32,813. Spacing: ~12-30 m. Units: m.
Surface elevation and ice thickness, western Marie Byrd Land, Antarctica: surface elevation (nsidc-0119.elevation)
This group is composed of a low resolution (750 m) linearly-interpolated raster grid at small map scales and a high resolution set of 2,536,493 point measurements at large map scales.
Surface elevation and ice thickness, western Marie Byrd Land, Antarctica: surface elevation: low resolution (nsidc-0119.elevation.lowres)
Luyendyk, B. and D. Wilson. 2003. Surface elevation and ice thickness, western Marie Byrd Land, Antarctica Boulder, Colorado USA: National Snow and Ice Data Center. Digital media. Available at http://nsidc.org/data/nsidc-0119.html. Accessed 23 December 2008. Background: This layer provides surface elevation data for a portion of the Marie Byrd Land sector of West Antarctica, including the Ford Ranges, the Sulzberger Ice Shelf, much of the Edward VII Peninsula, and the Shirase Coast region of the eastern Ross Ice Shelf. The investigators used laser altimetry from a Twin Otter aircraft flying at varying altitudes, at least 300 m above the surface, at an air speed of about 130 knots. Time period: 25-27 December 1998. Flight tracks: 64. Track spacing: either 5.3 or 10.6 km. Sample points: 2,536,493. Sample spacing: ~10 m. Units: m (vs. WGS84 ellipsoid). This layer is a reduced resolution grid (750 m) of linearly interpolated values.
Surface elevation and ice thickness, western Marie Byrd Land, Antarctica: surface elevation: high resolution (nsidc-0119.elevation.highres)
Luyendyk, B. and D. Wilson. 2003. Surface elevation and ice thickness, western Marie Byrd Land, Antarctica Boulder, Colorado USA: National Snow and Ice Data Center. Digital media. Available at http://nsidc.org/data/nsidc-0119.html. Accessed 23 December 2008. Background: This layer provides surface elevation data for a portion of the Marie Byrd Land sector of West Antarctica, including the Ford Ranges, the Sulzberger Ice Shelf, much of the Edward VII Peninsula, and the Shirase Coast region of the eastern Ross Ice Shelf. The investigators used laser altimetry from a Twin Otter aircraft flying at varying altitudes, at least 300 m above the surface, at an air speed of about 130 knots. Time period: 25-27 December 1998. Flight tracks: 64. Track spacing: either 5.3 or 10.6 km. Sample points: 2,536,493. Sample spacing: ~10 m. Units: m (vs. WGS84 ellipsoid).
Surface elevation and ice thickness, western Marie Byrd Land, Antarctica: ice thickness (nsidc-0119.ice_thickness)
This group is composed of a low resolution (750 m) linearly-interpolated raster grid at small map scales and a high resolution set of 1,882,811 point measurements at large map scales.
Surface elevation and ice thickness, western Marie Byrd Land, Antarctica: ice thickness: low resolution (nsidc-0119.ice_thickness.lowres)
Luyendyk, B. and D. Wilson. 2003. Surface elevation and ice thickness, western Marie Byrd Land, Antarctica Boulder, Colorado USA: National Snow and Ice Data Center. Digital media. Available at http://nsidc.org/data/nsidc-0119.html. Accessed 23 December 2008. Background: This layer provides ice thickness data for a portion of the Marie Byrd Land sector of West Antarctica, including the Ford Ranges, the Sulzberger Ice Shelf, much of the Edward VII Peninsula, and the Shirase Coast region of the eastern Ross Ice Shelf. The investigators used radar sounding from a Twin Otter aircraft flying at varying altitudes, at least 300 m above the surface, at an air speed of about 130 knots. Time period: 25-27 December 1998. Flight tracks: 64. Track spacing: either 5.3 or 10.6 km. Sample points: 1,882,811. Sample spacing: ~10 m. Units: m. This layer is a reduced resolution grid (750 m) of linearly interpolated values.
Surface elevation and ice thickness, western Marie Byrd Land, Antarctica: ice thickness: high resolution (nsidc-0119.ice_thickness.highres)
Luyendyk, B. and D. Wilson. 2003. Surface elevation and ice thickness, western Marie Byrd Land, Antarctica Boulder, Colorado USA: National Snow and Ice Data Center. Digital media. Available at http://nsidc.org/data/nsidc-0119.html. Accessed 23 December 2008. Background: This layer provides ice thickness data for a portion of the Marie Byrd Land sector of West Antarctica, including the Ford Ranges, the Sulzberger Ice Shelf, much of the Edward VII Peninsula, and the Shirase Coast region of the eastern Ross Ice Shelf. The investigators used radar sounding from a Twin Otter aircraft flying at varying altitudes, at least 300 m above the surface, at an air speed of about 130 knots. Time period: 25-27 December 1998. Flight tracks: 64. Track spacing: either 5.3 or 10.6 km. Sample points: 1,882,811. Sample spacing: ~10 m. Units: m.
Subglacial topography: airborne geophysical survey of the Amundsen Sea Embayment, Antarctica: bedrock elevation (nsidc-0292.bedrock_elevation)
Holt, J. W., D. D. Blankenship, and D. L. Morse. 2006. Subglacial topography: airborne geophysical survey of the Amundsen Sea Embayment, Antarctica. Boulder, Colorado USA: National Snow and Ice Data Center. Digital media. Available at http://nsidc.org/data/nsidc-0292.html. Accessed 21 July 2008. Background: This data set includes 5 km gridded data from the Airborne Geophysical Survey of the Amundsen Sea Embayment, Antarctica (AGASEA) conducted during the 2004-2005 austral summer. Investigators derived maps of the ice sheet surface and subglacial topography, which covers the entire catchments of both the Thwaites Glacier and the Pine Islands Glacier, from airborne survey systems mounted on a Twin Otter aircraft. The surveys had sufficient density to identify critical ice dynamic transitions within the Amundsen Sea Embayment (ASE). Instruments: airborne radar--High-Capability Radar Sounder (HICARS) and PASIN. Sample Points: 31,171.
Subglacial topography: airborne geophysical survey of the Amundsen Sea Embayment, Antarctica: ice thickness (nsidc-0292.ice_thickness)
Holt, J. W., D. D. Blankenship, and D. L. Morse. 2006. Subglacial topography: airborne geophysical survey of the Amundsen Sea Embayment, Antarctica. Boulder, Colorado USA: National Snow and Ice Data Center. Digital media. Available at http://nsidc.org/data/nsidc-0292.html. Accessed 21 July 2008. Background: This data set includes 5 km gridded data from the Airborne Geophysical Survey of the Amundsen Sea Embayment, Antarctica (AGASEA) conducted during the 2004-2005 austral summer. Investigators derived maps of the ice sheet surface and subglacial topography, which covers the entire catchments of both the Thwaites Glacier and the Pine Islands Glacier, from airborne survey systems mounted on a Twin Otter aircraft. The surveys had sufficient density to identify critical ice dynamic transitions within the Amundsen Sea Embayment (ASE). Instruments: airborne radar--High-Capability Radar Sounder (HICARS) and PASIN. Sample Points: 31,171.
Stable isotopes of ice on the surface of Taylor Glacier, Antarctica: Oxygen isotope ratio (nsidc-0323.oxygen)
Cuffey, K., A. Bliss, J. Kavanaugh, and S. Aciego. 2007. Stable isotopes of ice on the surface of Taylor Glacier, Antarctica. Boulder, Colorado USA: National Snow and Ice Data Center. Digital Media. Available at http://nsidc.org/data/nsidc-0323.html. Accessed 13 August 2008. Background: This data set contains Oxygen and Deuterium isotope ratios for approximately 980 sites on the surface of the ablation zone of Taylor Glacier, Antarctica. The data set gives latitude and longitude of collection, Oxygen ratio (18/16) in per mil, and Deuterium ratio (H/D) in per mil. Sample Points: 983. Sample Depth: 10 cm. Transect Length: 28 km. This layer provides the WMS for the Oxygen isotope ratio and the WFS for both ratios.
Stable isotopes of ice on the surface of Taylor Glacier, Antarctica: Deuterium isotope ratio (nsidc-0323.deuterium)
Cuffey, K., A. Bliss, J. Kavanaugh, and S. Aciego. 2007. Stable isotopes of ice on the surface of Taylor Glacier, Antarctica. Boulder, Colorado USA: National Snow and Ice Data Center. Digital Media. Available at http://nsidc.org/data/nsidc-0323.html. Accessed 13 August 2008. Background: This data set contains Oxygen and Deuterium isotope ratios for approximately 980 sites on the surface of the ablation zone of Taylor Glacier, Antarctica. The data set gives latitude and longitude of collection, Oxygen ratio (18/16) in per mil, and Deuterium ratio (H/D) in per mil. Sample Points: 983. Sample Depth: 10 cm. Transect Length: 28 km. This layer provides the WMS for the Deuterium isotope ratio and the WFS for both ratios.
Surface velocities of Taylor Glacier, Antarctica: Elevation (nsidc-0324.elevation)
Cuffey, K., A. Bliss, J. Kavanaugh, and S. Aciego. 2007. Surface velocities of Taylor Glacier, Antarctica. Boulder, Colorado USA: National Snow and Ice Data Center. Digital Media. Availabled at http://nsidc.org/data/nsidc-0324.html. Accessed 22 December 2008. Background: This data set contains surface velocities of Taylor Glacier, Antarctica, for the year 2003. Measurement period was approximately 12 months. Sample Points: 276. The data set includes the elevation, the velocity magnitude, the east component of velocity, the north component of velocity, and the vertical component of velocity. Instrument: differential Global Positioning System (GPS).
Surface velocities of Taylor Glacier, Antarctica: Velocity Magnitude (nsidc-0324.velocity_magnitude)
Cuffey, K., A. Bliss, J. Kavanaugh, and S. Aciego. 2007. Surface velocities of Taylor Glacier, Antarctica. Boulder, Colorado USA: National Snow and Ice Data Center. Digital Media. Availabled at http://nsidc.org/data/nsidc-0324.html. Accessed 22 December 2008. Background: This data set contains surface velocities of Taylor Glacier, Antarctica, for the year 2003. Measurement period was approximately 12 months. Sample Points: 276. The data set includes the elevation, the velocity magnitude, the east component of velocity, the north component of velocity, and the vertical component of velocity. Instrument: differential Global Positioning System (GPS).
Surface velocities of Taylor Glacier, Antarctica: Velocity East Component (nsidc-0324.velocity_east_component)
Cuffey, K., A. Bliss, J. Kavanaugh, and S. Aciego. 2007. Surface velocities of Taylor Glacier, Antarctica. Boulder, Colorado USA: National Snow and Ice Data Center. Digital Media. Availabled at http://nsidc.org/data/nsidc-0324.html. Accessed 22 December 2008. Background: This data set contains surface velocities of Taylor Glacier, Antarctica, for the year 2003. Measurement period was approximately 12 months. Sample Points: 276. The data set includes the elevation, the velocity magnitude, the east component of velocity, the north component of velocity, and the vertical component of velocity. Instrument: differential Global Positioning System (GPS).
Surface velocities of Taylor Glacier, Antarctica: Velocity North Component (nsidc-0324.velocity_north_component)
Cuffey, K., A. Bliss, J. Kavanaugh, and S. Aciego. 2007. Surface velocities of Taylor Glacier, Antarctica. Boulder, Colorado USA: National Snow and Ice Data Center. Digital Media. Availabled at http://nsidc.org/data/nsidc-0324.html. Accessed 22 December 2008. Background: This data set contains surface velocities of Taylor Glacier, Antarctica, for the year 2003. Measurement period was approximately 12 months. Sample Points: 276. The data set includes the elevation, the velocity magnitude, the east component of velocity, the north component of velocity, and the vertical component of velocity. Instrument: differential Global Positioning System (GPS).
Surface velocities of Taylor Glacier, Antarctica: Velocity Vertical Component (nsidc-0324.velocity_vertical_component)
Cuffey, K., A. Bliss, J. Kavanaugh, and S. Aciego. 2007. Surface velocities of Taylor Glacier, Antarctica. Boulder, Colorado USA: National Snow and Ice Data Center. Digital Media. Availabled at http://nsidc.org/data/nsidc-0324.html. Accessed 22 December 2008. Background: This data set contains surface velocities of Taylor Glacier, Antarctica, for the year 2003. Measurement period was approximately 12 months. Sample Points: 276. The data set includes the elevation, the velocity magnitude, the east component of velocity, the north component of velocity, and the vertical component of velocity. Instrument: differential Global Positioning System (GPS).
Ablation rates of Taylor Glacier, Antarctica (nsidc-0326)
Cuffey, K., A. Bliss, and J. Kavanaugh. 2007. Ablation rates of Taylor Glacier, Antarctica. Boulder, Colorado USA: National Snow and Ice Data Center. Digital Media. Available at http://nsidc.org/data/nsidc-0292.html. Accessed 26 November 2008. Background: This data set provides glacier surface ablation rates for a network of approximately 250 sites on Taylor Glacier, for year 2003. Here sublimation is the dominant ablation mechanism, though a few sites have accumulation.
Airborne laser altimetry of the Thwaites Glacier Catchment, West Antarctica (nsidc-0334)
This group is composed of a low resolution (750 m) linearly-interpolated raster grid at small map scales and a high resolution set of 1,600,801 point measurements at large map scales.
Airborne laser altimetry of the Thwaites Glacier Catchment, West Antarctica: low resolution (nsidc-0334.lowres)
Young, D. A., S. D. Kempf, D. D. Blankenship, J. W. Holt, and D. L. Morse. 2008. Airborne laser altimetry of the Thwaites Glacier Catchment, West Antarctica Boulder, Colorado USA: National Snow and Ice Data Center. Digital media. Available at http://nsidc.org/data/nsidc-0334.html. Accessed 05 December 2008. Background: This data set includes airborne altimetry collected over the catchment and main trunk of Thwaites Glacier, one of Antarctica's most active ice streams. The airborne altimetry comprises 35,000 line-kilometers sampled at 20 meters along track. The full dataset has an internal error of +/-20 cm; a primary subset has an error of +/-8 cm. We find a +20 cm bias with Geoscience Laser Altimeter System data over a flat interior region. These data will serve as an additional temporal reference for the evolution of Thwaites Glacier surface, as well as aid the construction of future high resolution Digital Elevation Models (DEM). Time Period: 10 December 2004 through 29 January 2005. Track Spacing: typically 15 km. Sample Points: 1,600,801. Sample Spacing: 20 m. Units: m surface elevation (vs. WGS84 ellipsoid). This layer is a reduced resolution grid (750 m) of linearly interpolated values.
Airborne laser altimetry of the Thwaites Glacier Catchment, West Antarctica: low resolution (nsidc-0334.highres)
Young, D. A., S. D. Kempf, D. D. Blankenship, J. W. Holt, and D. L. Morse. 2008. Airborne laser altimetry of the Thwaites Glacier Catchment, West Antarctica Boulder, Colorado USA: National Snow and Ice Data Center. Digital media. Available at http://nsidc.org/data/nsidc-0334.html. Accessed 05 December 2008. Background: This data set includes airborne altimetry collected over the catchment and main trunk of Thwaites Glacier, one of Antarctica's most active ice streams. The airborne altimetry comprises 35,000 line-kilometers sampled at 20 meters along track. The full dataset has an internal error of +/-20 cm; a primary subset has an error of +/-8 cm. We find a +20 cm bias with Geoscience Laser Altimeter System data over a flat interior region. These data will serve as an additional temporal reference for the evolution of Thwaites Glacier surface, as well as aid the construction of future high resolution Digital Elevation Models (DEM). Time Period: 10 December 2004 through 29 January 2005. Track Spacing: typically 15 km. Sample Points: 1,600,801. Sample Spacing: 20 m. Units: m surface elevation (vs. WGS84 ellipsoid). This layer is a reduced resolution grid (750 m) of linearly interpolated values.
VELMAP: Amery Ice Shelf 1968-1991 (velmap_amery_1968_1991)
Scambos, T., B. Raup, and J. Bohlander. Compilers. 2001. VELMAP: Antarctic ice velocity data. Boulder, Colorado USA: National Snow and Ice Data Center. Digital Media. Available at http://nsidc.org/data/velmap/. Accessed 11 February 2009; Allison, Ian. 1979. The mass budget of the Lambert Glacier drainage basin, Antarctica. Journal of Glaciology 22(87): 223-235. Other citations. Instrument: GPS, tacheometer, theodolite. Time Period: Dec. 1968 to Jan. 1991. Sample Points: 137. Units: meters per year.
VELMAP: Amery Ice Shelf 1968-1991 (graded) (velmap_amery_1968_1991_graded)
Scambos, T., B. Raup, and J. Bohlander. Compilers. 2001. VELMAP: Antarctic ice velocity data. Boulder, Colorado USA: National Snow and Ice Data Center. Digital Media. Available at http://nsidc.org/data/velmap/. Accessed 11 February 2009; Allison, Ian. 1979. The mass budget of the Lambert Glacier drainage basin, Antarctica. Journal of Glaciology 22(87): 223-235. Other citations. Instrument: GPS, tacheometer, theodolite. Time Period: Dec. 1968 to Jan. 1991. Sample Points: 137. Units: meters per year.
VELMAP: Amery Ice Shelf 1990-1995 (velmap_amery_1990_1995)
Scambos, T., B. Raup, and J. Bohlander. Compilers. 2001. VELMAP: Antarctic ice velocity data. Boulder, Colorado USA: National Snow and Ice Data Center. Digital Media. Available at http://nsidc.org/data/velmap/. Accessed 11 February 2009; Allison, Ian. 1979. The mass budget of the Lambert Glacier drainage basin, Antarctica. Journal of Glaciology 22(87): 223-235. Other citations. Instrument: GPS. Time Period: 1990-1995. Sample Points: 73. Units: meters per year.
VELMAP: Amery Ice Shelf 1990-1995 (graded) (velmap_amery_1990_1995_graded)
Scambos, T., B. Raup, and J. Bohlander. Compilers. 2001. VELMAP: Antarctic ice velocity data. Boulder, Colorado USA: National Snow and Ice Data Center. Digital Media. Available at http://nsidc.org/data/velmap/. Accessed 11 February 2009; Allison, Ian. 1979. The mass budget of the Lambert Glacier drainage basin, Antarctica. Journal of Glaciology 22(87): 223-235. Other citations. Instrument: GPS. Time Period: 1990-1995. Sample Points: 73. Units: meters per year.
VELMAP: Byrd Glacier 1978-1979 (velmap_byrd_1978_1979)
Scambos, T., B. Raup, and J. Bohlander. Compilers. 2001. VELMAP: Antarctic ice velocity data. Boulder, Colorado USA: National Snow and Ice Data Center. Digital Media. Available at http://nsidc.org/data/velmap/. Accessed 11 February 2009; Brecher, Henry H. 1982. Photogrammetric determination of surface velocities and elevations on Byrd Glacier. Antarctic Journal of the United States 17(5): 79-81. Other citations. Instrument: aerial photography. Time Period: Dec. 6, 1978 to Jan. 31, 1979. Sample Points: 470. Units: meters per year.
VELMAP: Byrd Glacier 1978-1979 (graded) (velmap_byrd_1978_1979_graded)
Scambos, T., B. Raup, and J. Bohlander. Compilers. 2001. VELMAP: Antarctic ice velocity data. Boulder, Colorado USA: National Snow and Ice Data Center. Digital Media. Available at http://nsidc.org/data/velmap/. Accessed 11 February 2009; Brecher, Henry H. 1982. Photogrammetric determination of surface velocities and elevations on Byrd Glacier. Antarctic Journal of the United States 17(5): 79-81. Other citations. Instrument: aerial photography. Time Period: Dec. 6, 1978 to Jan. 31, 1979. Sample Points: 470. Units: meters per year.
VELMAP: Crane Glacier 12/2002-02/2003 (velmap_crane_1202_0203)
Scambos, T., B. Raup, and J. Bohlander. Compilers. 2001. VELMAP: Antarctic ice velocity data. Boulder, Colorado USA: National Snow and Ice Data Center. Digital Media. Available at http://nsidc.org/data/velmap/. Accessed 11 February 2009; Scambos, T. A., J. A. Bohlander, C. A. Shuman, and P. Skvarca. 2004. Glacier acceleration and thinning after ice shelf collapse in the Larsen B embayment, Antarctica. Geophysical Research Letters 31, L18402, doi:10.1029/2004GL020670; Instrument: Landsat. Time Period: Dec. 18, 2002 to Feb. 20, 2003. Sample Points: 6482. Units: meters per year.
VELMAP: Crane Glacier 12/2002-02/2003 (graded) (velmap_crane_1202_0203_graded)
Scambos, T., B. Raup, and J. Bohlander. Compilers. 2001. VELMAP: Antarctic ice velocity data. Boulder, Colorado USA: National Snow and Ice Data Center. Digital Media. Available at http://nsidc.org/data/velmap/. Accessed 11 February 2009; Scambos, T. A., J. A. Bohlander, C. A. Shuman, and P. Skvarca. 2004. Glacier acceleration and thinning after ice shelf collapse in the Larsen B embayment, Antarctica. Geophysical Research Letters 31, L18402, doi:10.1029/2004GL020670; Instrument: Landsat. Time Period: Dec. 18, 2002 to Feb. 20, 2003. Sample Points: 6482. Units: meters per year.
VELMAP: Crane Glacier 04/2002-12/2002 (velmap_crane_0402_1202)
Scambos, T., B. Raup, and J. Bohlander. Compilers. 2001. VELMAP: Antarctic ice velocity data. Boulder, Colorado USA: National Snow and Ice Data Center. Digital Media. Available at http://nsidc.org/data/velmap/. Accessed 11 February 2009; Scambos, T. A., J. A. Bohlander, C. A. Shuman, and P. Skvarca. 2004. Glacier acceleration and thinning after ice shelf collapse in the Larsen B embayment, Antarctica. Geophysical Research Letters 31, L18402, doi:10.1029/2004GL020670; Instrument: Landsat. Time Period: Apr. 6, 2002 to Dec. 18, 2002. Sample Points: 1594. Units: meters per year.
VELMAP: Crane Glacier 04/2002-12/2002 (graded) (velmap_crane_0402_1202_graded)
Scambos, T., B. Raup, and J. Bohlander. Compilers. 2001. VELMAP: Antarctic ice velocity data. Boulder, Colorado USA: National Snow and Ice Data Center. Digital Media. Available at http://nsidc.org/data/velmap/. Accessed 11 February 2009; Scambos, T. A., J. A. Bohlander, C. A. Shuman, and P. Skvarca. 2004. Glacier acceleration and thinning after ice shelf collapse in the Larsen B embayment, Antarctica. Geophysical Research Letters 31, L18402, doi:10.1029/2004GL020670; Instrument: Landsat. Time Period: Apr. 6, 2002 to Dec. 18, 2002. Sample Points: 1594. Units: meters per year.
VELMAP: Crane Glacier 04/2002-02/2003 (velmap_crane_0402_0203)
Scambos, T., B. Raup, and J. Bohlander. Compilers. 2001. VELMAP: Antarctic ice velocity data. Boulder, Colorado USA: National Snow and Ice Data Center. Digital Media. Available at http://nsidc.org/data/velmap/. Accessed 11 February 2009; Scambos, T. A., J. A. Bohlander, C. A. Shuman, and P. Skvarca. 2004. Glacier acceleration and thinning after ice shelf collapse in the Larsen B embayment, Antarctica. Geophysical Research Letters 31, L18402, doi:10.1029/2004GL020670; Instrument: Landsat. Time Period: Apr. 6, 2002 to Feb. 20, 2003. Sample Points: 1013. Units: meters per year.
VELMAP: Crane Glacier 04/2002-02/2003 (graded) (velmap_crane_0402_0203_graded)
Scambos, T., B. Raup, and J. Bohlander. Compilers. 2001. VELMAP: Antarctic ice velocity data. Boulder, Colorado USA: National Snow and Ice Data Center. Digital Media. Available at http://nsidc.org/data/velmap/. Accessed 11 February 2009; Scambos, T. A., J. A. Bohlander, C. A. Shuman, and P. Skvarca. 2004. Glacier acceleration and thinning after ice shelf collapse in the Larsen B embayment, Antarctica. Geophysical Research Letters 31, L18402, doi:10.1029/2004GL020670; Instrument: Landsat. Time Period: Apr. 6, 2002 to Feb. 20, 2003. Sample Points: 1013. Units: meters per year.
VELMAP: Crane Glacier 12/2001-12/2002 (velmap_crane_1201_1202)
Scambos, T., B. Raup, and J. Bohlander. Compilers. 2001. VELMAP: Antarctic ice velocity data. Boulder, Colorado USA: National Snow and Ice Data Center. Digital Media. Available at http://nsidc.org/data/velmap/. Accessed 11 February 2009; Scambos, T. A., J. A. Bohlander, C. A. Shuman, and P. Skvarca. 2004. Glacier acceleration and thinning after ice shelf collapse in the Larsen B embayment, Antarctica. Geophysical Research Letters 31, L18402, doi:10.1029/2004GL020670; Instrument: Landsat. Time Period: Dec. 6, 2001 to Dec. 18, 2002. Sample Points: 419. Units: meters per year.
VELMAP: Crane Glacier 12/2001-12/2002 (graded) (velmap_crane_1201_1202_graded)
Scambos, T., B. Raup, and J. Bohlander. Compilers. 2001. VELMAP: Antarctic ice velocity data. Boulder, Colorado USA: National Snow and Ice Data Center. Digital Media. Available at http://nsidc.org/data/velmap/. Accessed 11 February 2009; Scambos, T. A., J. A. Bohlander, C. A. Shuman, and P. Skvarca. 2004. Glacier acceleration and thinning after ice shelf collapse in the Larsen B embayment, Antarctica. Geophysical Research Letters 31, L18402, doi:10.1029/2004GL020670; Instrument: Landsat. Time Period: Dec. 6, 2001 to Dec. 18, 2002. Sample Points: 419. Units: meters per year.
VELMAP: Crane Glacier 01/2000-12/2001 (velmap_crane_0100_1201)
Scambos, T., B. Raup, and J. Bohlander. Compilers. 2001. VELMAP: Antarctic ice velocity data. Boulder, Colorado USA: National Snow and Ice Data Center. Digital Media. Available at http://nsidc.org/data/velmap/. Accessed 11 February 2009; Scambos, T. A., J. A. Bohlander, C. A. Shuman, and P. Skvarca. 2004. Glacier acceleration and thinning after ice shelf collapse in the Larsen B embayment, Antarctica. Geophysical Research Letters 31, L18402, doi:10.1029/2004GL020670; Instrument: Landsat. Time Period: Jan. 27, 2000 to Dec. 6, 2001. Sample Points: 238. Units: meters per year.
VELMAP: Crane Glacier 01/2000-12/2001 (graded) (velmap_crane_0100_1201_graded)
Scambos, T., B. Raup, and J. Bohlander. Compilers. 2001. VELMAP: Antarctic ice velocity data. Boulder, Colorado USA: National Snow and Ice Data Center. Digital Media. Available at http://nsidc.org/data/velmap/. Accessed 11 February 2009; Scambos, T. A., J. A. Bohlander, C. A. Shuman, and P. Skvarca. 2004. Glacier acceleration and thinning after ice shelf collapse in the Larsen B embayment, Antarctica. Geophysical Research Letters 31, L18402, doi:10.1029/2004GL020670; Instrument: Landsat. Time Period: Jan. 27, 2000 to Dec. 6, 2001. Sample Points: 238. Units: meters per year.
VELMAP: Crane Glacier 01/2000-04/2002 (velmap_crane_0100_0402)
Scambos, T., B. Raup, and J. Bohlander. Compilers. 2001. VELMAP: Antarctic ice velocity data. Boulder, Colorado USA: National Snow and Ice Data Center. Digital Media. Available at http://nsidc.org/data/velmap/. Accessed 11 February 2009; Scambos, T. A., J. A. Bohlander, C. A. Shuman, and P. Skvarca. 2004. Glacier acceleration and thinning after ice shelf collapse in the Larsen B embayment, Antarctica. Geophysical Research Letters 31, L18402, doi:10.1029/2004GL020670; Instrument: Landsat. Time Period: Jan. 27, 2000 to Apr. 6, 2002. Sample Points: 115. Units: meters per year.
VELMAP: Crane Glacier 01/2000-04/2002 (graded) (velmap_crane_0100_0402_graded)
Scambos, T., B. Raup, and J. Bohlander. Compilers. 2001. VELMAP: Antarctic ice velocity data. Boulder, Colorado USA: National Snow and Ice Data Center. Digital Media. Available at http://nsidc.org/data/velmap/. Accessed 11 February 2009; Scambos, T. A., J. A. Bohlander, C. A. Shuman, and P. Skvarca. 2004. Glacier acceleration and thinning after ice shelf collapse in the Larsen B embayment, Antarctica. Geophysical Research Letters 31, L18402, doi:10.1029/2004GL020670; Instrument: Landsat. Time Period: Jan. 27, 2000 to Apr. 6, 2002. Sample Points: 115. Units: meters per year.
VELMAP: Crane Glacier 12/2001-04/2002 (velmap_crane_1201_0402)
Scambos, T., B. Raup, and J. Bohlander. Compilers. 2001. VELMAP: Antarctic ice velocity data. Boulder, Colorado USA: National Snow and Ice Data Center. Digital Media. Available at http://nsidc.org/data/velmap/. Accessed 11 February 2009; Scambos, T. A., J. A. Bohlander, C. A. Shuman, and P. Skvarca. 2004. Glacier acceleration and thinning after ice shelf collapse in the Larsen B embayment, Antarctica. Geophysical Research Letters 31, L18402, doi:10.1029/2004GL020670; Instrument: Landsat. Time Period: Dec. 6, 2001 to Apr. 6, 2002. Sample Points: 178. Units: meters per year.
VELMAP: Crane Glacier 12/2001-04/2002 (graded) (velmap_crane_1201_0402_graded)
Scambos, T., B. Raup, and J. Bohlander. Compilers. 2001. VELMAP: Antarctic ice velocity data. Boulder, Colorado USA: National Snow and Ice Data Center. Digital Media. Available at http://nsidc.org/data/velmap/. Accessed 11 February 2009; Scambos, T. A., J. A. Bohlander, C. A. Shuman, and P. Skvarca. 2004. Glacier acceleration and thinning after ice shelf collapse in the Larsen B embayment, Antarctica. Geophysical Research Letters 31, L18402, doi:10.1029/2004GL020670; Instrument: Landsat. Time Period: Dec. 6, 2001 to Apr. 6, 2002. Sample Points: 178. Units: meters per year.
VELMAP: David Glacier 1990-1992 (velmap_david_1990_1992)
Scambos, T., B. Raup, and J. Bohlander. Compilers. 2001. VELMAP: Antarctic ice velocity data. Boulder, Colorado USA: National Snow and Ice Data Center. Digital Media. Available at http://nsidc.org/data/velmap/. Accessed 11 February 2009; Frezzotti M., A. Capra, and L. Vittuari. 1998. Comparison between glacier ice velocities inferred from GPS and sequential satellite images. Annals of Glaciology 27: 54-60. Other citations. Instrument: Landsat. Time Period: Jan. 17, 1990 to Jan. 14, 1992. Sample Points: 965. Units: meters per year.
VELMAP: David Glacier 1990-1992 (graded) (velmap_david_1990_1992_graded)
Scambos, T., B. Raup, and J. Bohlander. Compilers. 2001. VELMAP: Antarctic ice velocity data. Boulder, Colorado USA: National Snow and Ice Data Center. Digital Media. Available at http://nsidc.org/data/velmap/. Accessed 11 February 2009; Frezzotti M., A. Capra, and L. Vittuari. 1998. Comparison between glacier ice velocities inferred from GPS and sequential satellite images. Annals of Glaciology 27: 54-60. Other citations. Instrument: Landsat. Time Period: Jan. 17, 1990 to Jan. 14, 1992. Sample Points: 965. Units: meters per year.
VELMAP: Filchner-Ronne Ice Shelf 1986-1994 (velmap_fris_1986_1994)
Scambos, T., B. Raup, and J. Bohlander. Compilers. 2001. VELMAP: Antarctic ice velocity data. Boulder, Colorado USA: National Snow and Ice Data Center. Digital Media. Available at http://nsidc.org/data/velmap/. Accessed 11 February 2009; Vaughan, D. G. and M. Jonas. 1996. Measurements of velocity of Filchner-Ronne Ice Shelf. Filchner-Ronne Ice Shelf Programme (FRISP) Report No. 10. Compiled by Hans Oerter. Bremerhaven, Germany: Alfred Wegener Institute (AWI). pp. 111-116. Other citations. Instrument: Landsat MMS, ERS-1 SAR. Time Period: 1986-1994. Sample Points: 228. Units: meters per year.
VELMAP: Filchner-Ronne Ice Shelf 1986-1994 (graded) (velmap_fris_1986_1994_graded)
Scambos, T., B. Raup, and J. Bohlander. Compilers. 2001. VELMAP: Antarctic ice velocity data. Boulder, Colorado USA: National Snow and Ice Data Center. Digital Media. Available at http://nsidc.org/data/velmap/. Accessed 11 February 2009; Vaughan, D. G. and M. Jonas. 1996. Measurements of velocity of Filchner-Ronne Ice Shelf. Filchner-Ronne Ice Shelf Programme (FRISP) Report No. 10. Compiled by Hans Oerter. Bremerhaven, Germany: Alfred Wegener Institute (AWI). pp. 111-116. Other citations. Instrument: Landsat MMS, ERS-1 SAR. Time Period: 1986-1994. Sample Points: 228. Units: meters per year.
VELMAP: Filchner-Ronne Ice Shelf 1980-1993 (velmap_fris_1980_1993)
Scambos, T., B. Raup, and J. Bohlander. Compilers. 2001. VELMAP: Antarctic ice velocity data. Boulder, Colorado USA: National Snow and Ice Data Center. Digital Media. Available at http://nsidc.org/data/velmap/. Accessed 11 February 2009; Vaughan, D. G. and M. Jonas. 1996. Measurements of velocity of Filchner-Ronne Ice Shelf. Filchner-Ronne Ice Shelf Programme (FRISP) Report No. 10. Compiled by Hans Oerter. Bremerhaven, Germany: Alfred Wegener Institute (AWI). pp. 111-116. Other citations. Instrument: geodetic surveys, GPS, satellite imagery. Time Period: 1980-1993. Sample Points: 92. Units: meters per year.
VELMAP: Filchner-Ronne Ice Shelf 1980-1993 (graded) (velmap_fris_1980_1993_graded)
Scambos, T., B. Raup, and J. Bohlander. Compilers. 2001. VELMAP: Antarctic ice velocity data. Boulder, Colorado USA: National Snow and Ice Data Center. Digital Media. Available at http://nsidc.org/data/velmap/. Accessed 11 February 2009; Vaughan, D. G. and M. Jonas. 1996. Measurements of velocity of Filchner-Ronne Ice Shelf. Filchner-Ronne Ice Shelf Programme (FRISP) Report No. 10. Compiled by Hans Oerter. Bremerhaven, Germany: Alfred Wegener Institute (AWI). pp. 111-116. Other citations. Instrument: geodetic surveys, GPS, satellite imagery. Time Period: 1980-1993. Sample Points: 92. Units: meters per year.
VELMAP: Institute Ice Stream 1986-1989 (velmap_institute_1986_1989)
Scambos, T., B. Raup, and J. Bohlander. 2001. VELMAP: Antarctic ice velocity data. Boulder, Colorado USA: National Snow and Ice Data Center. Digital Media. Available at http://nsidc.org/data/velmap/. Accessed 11 February 2009. Instrument: Landsat. Time Period: Feb. 16, 1986 to Jan. 15, 1989. Sample Points: 7829. Units: meters per year.
VELMAP: Institute Ice Stream 1986-1989 (graded) (velmap_institute_1986_1989_graded)
Scambos, T., B. Raup, and J. Bohlander. 2001. VELMAP: Antarctic ice velocity data. Boulder, Colorado USA: National Snow and Ice Data Center. Digital Media. Available at http://nsidc.org/data/velmap/. Accessed 11 February 2009. Instrument: Landsat. Time Period: Feb. 16, 1986 to Jan. 15, 1989. Sample Points: 7829. Units: meters per year.
VELMAP: Larsen B Ice Shelf 1997-1999 (velmap_larsenb_1997_1999)
Scambos, T., B. Raup, and J. Bohlander. Compilers. 2001. VELMAP: Antarctic ice velocity data. Boulder, Colorado USA: National Snow and Ice Data Center. Digital Media. Available at http://nsidc.org/data/velmap/. Accessed 11 February 2009; Skvarca, P., W. Rack and H. Rott. 1999. 34 year satellite time series to monitor characteristics, extent and dynamics of Larsen B Ice Shelf, Antarctic Peninsula. Annals of Glaciology 29: 255-260. Other citations. Instrument: GPS. Time Period: Sep. 29, 1997 to Sep. 23, 1999. Sample Points: 19. Units: meters per year.
VELMAP: Larsen B Ice Shelf 1997-1999 (graded) (velmap_larsenb_1997_1999_graded)
Scambos, T., B. Raup, and J. Bohlander. Compilers. 2001. VELMAP: Antarctic ice velocity data. Boulder, Colorado USA: National Snow and Ice Data Center. Digital Media. Available at http://nsidc.org/data/velmap/. Accessed 11 February 2009; Skvarca, P., W. Rack and H. Rott. 1999. 34 year satellite time series to monitor characteristics, extent and dynamics of Larsen B Ice Shelf, Antarctic Peninsula. Annals of Glaciology 29: 255-260. Other citations. Instrument: GPS. Time Period: Sep. 29, 1997 to Sep. 23, 1999. Sample Points: 19. Units: meters per year.
VELMAP: Mertz Glacier 02/2000-12/2001 (velmap_mertz_0200_1201)
Scambos, T., B. Raup, and J. Bohlander. Compilers. 2001. VELMAP: Antarctic ice velocity data. Boulder, Colorado USA: National Snow and Ice Data Center. Digital Media. Available at http://nsidc.org/data/velmap/. Accessed 11 February 2009; Berthier, E., B. Raup, and T. Scambos. 2003. New velocity map and mass-balance estimate of Mertz Glacier, East Antarctica, derived from Landsat sequential imagery. Journal of Glaciology 49(167): 503-511. Instrument: Landsat. Time Period: Feb. 26, 2000 to Dec. 13, 2001. Sample Points: 16669. Units: meters per year.
VELMAP: Mertz Glacier 02/2000-12/2001 (graded) (velmap_mertz_0200_1201_graded)
Scambos, T., B. Raup, and J. Bohlander. Compilers. 2001. VELMAP: Antarctic ice velocity data. Boulder, Colorado USA: National Snow and Ice Data Center. Digital Media. Available at http://nsidc.org/data/velmap/. Accessed 11 February 2009; Berthier, E., B. Raup, and T. Scambos. 2003. New velocity map and mass-balance estimate of Mertz Glacier, East Antarctica, derived from Landsat sequential imagery. Journal of Glaciology 49(167): 503-511. Instrument: Landsat. Time Period: Feb. 26, 2000 to Dec. 13, 2001. Sample Points: 16669. Units: meters per year.
VELMAP: Mertz Glacier 01/1989-02/2000 (velmap_mertz_0189_0200)
Scambos, T., B. Raup, and J. Bohlander. Compilers. 2001. VELMAP: Antarctic ice velocity data. Boulder, Colorado USA: National Snow and Ice Data Center. Digital Media. Available at http://nsidc.org/data/velmap/. Accessed 11 February 2009; Berthier, E., B. Raup, and T. Scambos. 2003. New velocity map and mass-balance estimate of Mertz Glacier, East Antarctica, derived from Landsat sequential imagery. Journal of Glaciology 49(167): 503-511. Instrument: Landsat. Time Period: Jan. 2, 1989 to Feb. 26, 2000. Sample Points: 431. Units: meters per year.
VELMAP: Mertz Glacier 01/1989-02/2000 (graded) (velmap_mertz_0189_0200_graded)
Scambos, T., B. Raup, and J. Bohlander. Compilers. 2001. VELMAP: Antarctic ice velocity data. Boulder, Colorado USA: National Snow and Ice Data Center. Digital Media. Available at http://nsidc.org/data/velmap/. Accessed 11 February 2009; Berthier, E., B. Raup, and T. Scambos. 2003. New velocity map and mass-balance estimate of Mertz Glacier, East Antarctica, derived from Landsat sequential imagery. Journal of Glaciology 49(167): 503-511. Instrument: Landsat. Time Period: Jan. 2, 1989 to Feb. 26, 2000. Sample Points: 431. Units: meters per year.
VELMAP: Mizuho Plateau 1969-1974 (velmap_mizuho_1969_1974)
Scambos, T., B. Raup, and J. Bohlander. Compilers. 2001. VELMAP: Antarctic ice velocity data. Boulder, Colorado USA: National Snow and Ice Data Center. Digital Media. Available at http://nsidc.org/data/velmap/. Accessed 11 February 2009; Takahashi, S. 1997. Ice sheet dynamics. In Antarctica: East Queen Maud Land - Enderby Land Glaciological Folio. Tokyo, Japan: National Institute of Polar Research. Other citations. Instrument: tacheometer, theodolite. Time Period: Dec. 15, 1969 to Jan. 15, 1974. Sample Points: 140. Units: meters per year.
VELMAP: Mizuho Plateau 1969-1974 (graded) (velmap_mizuho_1969_1974_graded)
Scambos, T., B. Raup, and J. Bohlander. Compilers. 2001. VELMAP: Antarctic ice velocity data. Boulder, Colorado USA: National Snow and Ice Data Center. Digital Media. Available at http://nsidc.org/data/velmap/. Accessed 11 February 2009; Takahashi, S. 1997. Ice sheet dynamics. In Antarctica: East Queen Maud Land - Enderby Land Glaciological Folio. Tokyo, Japan: National Institute of Polar Research. Other citations. Instrument: tacheometer, theodolite. Time Period: Dec. 15, 1969 to Jan. 15, 1974. Sample Points: 140. Units: meters per year.
VELMAP: Pine Island Glacier 1986-1988 (velmap_pine_1986_1988)
Scambos, T., B. Raup, and J. Bohlander. 2001. VELMAP: Antarctic ice velocity data. Boulder, Colorado USA: National Snow and Ice Data Center. Digital Media. Available at http://nsidc.org/data/velmap/. Accessed 11 February 2009. Instrument: Landsat. Time Period: Dec. 21, 1986 to Dec. 18, 1988. Sample Points: 1175. Units: meters per year.
VELMAP: Pine Island Glacier 1986-1988 (graded) (velmap_pine_1986_1988_graded)
Scambos, T., B. Raup, and J. Bohlander. 2001. VELMAP: Antarctic ice velocity data. Boulder, Colorado USA: National Snow and Ice Data Center. Digital Media. Available at http://nsidc.org/data/velmap/. Accessed 11 February 2009. Instrument: Landsat. Time Period: Dec. 21, 1986 to Dec. 18, 1988. Sample Points: 1175. Units: meters per year.
VELMAP: Pine Island Glacier 1973-1975 (velmap_pine_1973_1975)
Scambos, T., B. Raup, and J. Bohlander. 2001. VELMAP: Antarctic ice velocity data. Boulder, Colorado USA: National Snow and Ice Data Center. Digital Media. Available at http://nsidc.org/data/velmap/. Accessed 11 February 2009. Instrument: Landsat. Time Period: Jan. 24, 1973 to Feb. 13, 1975. Sample Points: 52. Units: meters per year.
VELMAP: Pine Island Glacier 1973-1975 (graded) (velmap_pine_1973_1975_graded)
Scambos, T., B. Raup, and J. Bohlander. 2001. VELMAP: Antarctic ice velocity data. Boulder, Colorado USA: National Snow and Ice Data Center. Digital Media. Available at http://nsidc.org/data/velmap/. Accessed 11 February 2009. Instrument: Landsat. Time Period: Jan. 24, 1973 to Feb. 13, 1975. Sample Points: 52. Units: meters per year.
VELMAP: Prestrud Inlet 1987-1989 (velmap_prestrud_1987_1989)
Scambos, T., B. Raup, and J. Bohlander. 2001. VELMAP: Antarctic ice velocity data. Boulder, Colorado USA: National Snow and Ice Data Center. Digital Media. Available at http://nsidc.org/data/velmap/. Accessed 11 February 2009. Instrument: Landsat. Time Period: Jan. 14, 1987 to Mar. 16, 1989. Sample Points: 2933. Units: meters per year.
VELMAP: Prestrud Inlet 1987-1989 (graded) (velmap_prestrud_1987_1989_graded)
Scambos, T., B. Raup, and J. Bohlander. 2001. VELMAP: Antarctic ice velocity data. Boulder, Colorado USA: National Snow and Ice Data Center. Digital Media. Available at http://nsidc.org/data/velmap/. Accessed 11 February 2009. Instrument: Landsat. Time Period: Jan. 14, 1987 to Mar. 16, 1989. Sample Points: 2933. Units: meters per year.
VELMAP: Priestley Glacier 1990-1992 (velmap_priestley_1990_1992)
Scambos, T., B. Raup, and J. Bohlander. Compilers. 2001. VELMAP: Antarctic ice velocity data. Boulder, Colorado USA: National Snow and Ice Data Center. Digital Media. Available at http://nsidc.org/data/velmap/. Accessed 11 February 2009; Frezzotti M., A. Capra, and L. Vittuari. 1998. Comparison between glacier ice velocities inferred from GPS and sequential satellite images. Annals of Glaciology 27: 54-60. Other citations. Instrument: Landsat. Time Period: Jan. 17, 1990 to Jan. 14, 1992. Sample Points: 406. Units: meters per year.
VELMAP: Priestley Glacier 1990-1992 (graded) (velmap_priestley_1990_1992_graded)
Scambos, T., B. Raup, and J. Bohlander. Compilers. 2001. VELMAP: Antarctic ice velocity data. Boulder, Colorado USA: National Snow and Ice Data Center. Digital Media. Available at http://nsidc.org/data/velmap/. Accessed 11 February 2009; Frezzotti M., A. Capra, and L. Vittuari. 1998. Comparison between glacier ice velocities inferred from GPS and sequential satellite images. Annals of Glaciology 27: 54-60. Other citations. Instrument: Landsat. Time Period: Jan. 17, 1990 to Jan. 14, 1992. Sample Points: 406. Units: meters per year.
VELMAP: Reeves Glacier 1988-1992 (velmap_reeves_1988_1992)
Scambos, T., B. Raup, and J. Bohlander. Compilers. 2001. VELMAP: Antarctic ice velocity data. Boulder, Colorado USA: National Snow and Ice Data Center. Digital Media. Available at http://nsidc.org/data/velmap/. Accessed 11 February 2009; Frezzotti M., A. Capra, and L. Vittuari. 1998. Comparison between glacier ice velocities inferred from GPS and sequential satellite images. Annals of Glaciology 27: 54-60. Other citations. Instrument: Landsat, SPOT. Time Period: Dec. 19, 1988 to Jan. 14, 1992. Sample Points: 408. Units: meters per year.
VELMAP: Reeves Glacier 1988-1992 (graded) (velmap_reeves_1988_1992_graded)
Scambos, T., B. Raup, and J. Bohlander. Compilers. 2001. VELMAP: Antarctic ice velocity data. Boulder, Colorado USA: National Snow and Ice Data Center. Digital Media. Available at http://nsidc.org/data/velmap/. Accessed 11 February 2009; Frezzotti M., A. Capra, and L. Vittuari. 1998. Comparison between glacier ice velocities inferred from GPS and sequential satellite images. Annals of Glaciology 27: 54-60. Other citations. Instrument: Landsat, SPOT. Time Period: Dec. 19, 1988 to Jan. 14, 1992. Sample Points: 408. Units: meters per year.
VELMAP: Ross Ice Shelf Geophysical and Glaciological Survey (RIGGS) (Actual) 1960-1977 (velmap_riggs_actual_1960_1977)
Scambos, T., B. Raup, and J. Bohlander. Compilers. 2001. VELMAP: Antarctic ice velocity data. Boulder, Colorado USA: National Snow and Ice Data Center. Digital Media. Available at http://nsidc.org/data/velmap/. Accessed 11 February 2009; Thomas, R. H., D. R. MacAyeal, D. H. Eilers, and D. R. Gaylord. 1984. Glaciological studies on the Ross Ice Shelf, Antarctica, 1972-1978. In The Ross Ice Shelf: Glaciology and Geophysics. Antarctic Research Series, Volume 42, Paper 2, 21-53. Instrument: satellite positioning (Transit/NavSat). Time Period: 1960-1977. Sample Points: 72. Units: meters per year.
VELMAP: Ross Ice Shelf Geophysical and Glaciological Survey (RIGGS) (Actual) 1960-1977 (graded) (velmap_riggs_actual_1960_1977_graded)
Scambos, T., B. Raup, and J. Bohlander. Compilers. 2001. VELMAP: Antarctic ice velocity data. Boulder, Colorado USA: National Snow and Ice Data Center. Digital Media. Available at http://nsidc.org/data/velmap/. Accessed 11 February 2009; Thomas, R. H., D. R. MacAyeal, D. H. Eilers, and D. R. Gaylord. 1984. Glaciological studies on the Ross Ice Shelf, Antarctica, 1972-1978. In The Ross Ice Shelf: Glaciology and Geophysics. Antarctic Research Series, Volume 42, Paper 2, 21-53. Instrument: satellite positioning (Transit/NavSat). Time Period: 1960-1977. Sample Points: 72. Units: meters per year.
VELMAP: Ross Ice Shelf Geophysical and Glaciological Survey (RIGGS) (Interpolated) 1956-1977 (velmap_riggs_interpolated_1956_1977)
Scambos, T., B. Raup, and J. Bohlander. Compilers. 2001. VELMAP: Antarctic ice velocity data. Boulder, Colorado USA: National Snow and Ice Data Center. Digital Media. Available at http://nsidc.org/data/velmap/. Accessed 11 February 2009; Thomas, R. H., D. R. MacAyeal, D. H. Eilers, and D. R. Gaylord. 1984. Glaciological studies on the Ross Ice Shelf, Antarctica, 1972-1978. In The Ross Ice Shelf: Glaciology and Geophysics. Antarctic Research Series, Volume 42, Paper 2, 21-53. Instrument: satellite positioning (Transit/NavSat). Time Period: 1956-1977. Sample Points: 77. Units: meters per year.
VELMAP: Ross Ice Shelf Geophysical and Glaciological Survey (RIGGS) (Interpolated) 1956-1977 (graded) (velmap_riggs_interpolated_1956_1977_graded)
Scambos, T., B. Raup, and J. Bohlander. Compilers. 2001. VELMAP: Antarctic ice velocity data. Boulder, Colorado USA: National Snow and Ice Data Center. Digital Media. Available at http://nsidc.org/data/velmap/. Accessed 11 February 2009; Thomas, R. H., D. R. MacAyeal, D. H. Eilers, and D. R. Gaylord. 1984. Glaciological studies on the Ross Ice Shelf, Antarctica, 1972-1978. In The Ross Ice Shelf: Glaciology and Geophysics. Antarctic Research Series, Volume 42, Paper 2, 21-53. Instrument: satellite positioning (Transit/NavSat). Time Period: 1956-1977. Sample Points: 77. Units: meters per year.
VELMAP: Northwest Ross Ice Shelf 03/1989-12/1989 (velmap_ross_nw_0389_1289)
Scambos, T., B. Raup, and J. Bohlander. 2001. VELMAP: Antarctic ice velocity data. Boulder, Colorado USA: National Snow and Ice Data Center. Digital Media. Available at http://nsidc.org/data/velmap/. Accessed 11 February 2009. Instrument: Landsat. Time Period: Mar. 15, 1989 to Dec. 28, 1989. Sample Points: 968. Units: meters per year.
VELMAP: Northwest Ross Ice Shelf 03/1989-12/1989 (graded) (velmap_ross_nw_0389_1289_graded)
Scambos, T., B. Raup, and J. Bohlander. 2001. VELMAP: Antarctic ice velocity data. Boulder, Colorado USA: National Snow and Ice Data Center. Digital Media. Available at http://nsidc.org/data/velmap/. Accessed 11 February 2009. Instrument: Landsat. Time Period: Mar. 15, 1989 to Dec. 28, 1989. Sample Points: 968. Units: meters per year.
VELMAP: Siple Coast Catchment Area 1984-1992 (velmap_siple_catchment_1984_1992)
Scambos, T., B. Raup, and J. Bohlander. Compilers. 2001. VELMAP: Antarctic ice velocity data. Boulder, Colorado USA: National Snow and Ice Data Center. Digital Media. Available at http://nsidc.org/data/velmap/. Accessed 11 February 2009; Price, S. F. and I. M. Whillans. 1998. Delineation of a catchment boundary using velocity and elevation measurements. Annals of Glaciology 27: 140-144. Other citations. Instrument: satellite positioning (Transit/NavSat). Time Period: 1984-1992. Sample Points: 125. Units: meters per year.
VELMAP: Siple Coast Catchment Area 1984-1992 (graded) (velmap_siple_catchment_1984_1992_graded)
Scambos, T., B. Raup, and J. Bohlander. Compilers. 2001. VELMAP: Antarctic ice velocity data. Boulder, Colorado USA: National Snow and Ice Data Center. Digital Media. Available at http://nsidc.org/data/velmap/. Accessed 11 February 2009; Price, S. F. and I. M. Whillans. 1998. Delineation of a catchment boundary using velocity and elevation measurements. Annals of Glaciology 27: 140-144. Other citations. Instrument: satellite positioning (Transit/NavSat). Time Period: 1984-1992. Sample Points: 125. Units: meters per year.
VELMAP: Siple Dome 1994-1996 (velmap_siple_dome_1994_1996)
Scambos, T., B. Raup, and J. Bohlander. Compilers. 2001. VELMAP: Antarctic ice velocity data. Boulder, Colorado USA: National Snow and Ice Data Center. Digital Media. Available at http://nsidc.org/data/velmap/. Accessed 11 February 2009; Nereson, N. 1998. The Flow history of Siple Dome and Ice Streams C and D, West Antarctica: Inferences from geophysical measurements and ice flow models. Ph.D. dissertation, University of Washington. Instrument: GPS. Time Period: Dec. 5, 1994 to Dec. 6, 1996. Sample Points: 88. Units: meters per year.
VELMAP: Siple Dome 1994-1996 (graded) (velmap_siple_dome_1994_1996_graded)
Scambos, T., B. Raup, and J. Bohlander. Compilers. 2001. VELMAP: Antarctic ice velocity data. Boulder, Colorado USA: National Snow and Ice Data Center. Digital Media. Available at http://nsidc.org/data/velmap/. Accessed 11 February 2009; Nereson, N. 1998. The Flow history of Siple Dome and Ice Streams C and D, West Antarctica: Inferences from geophysical measurements and ice flow models. Ph.D. dissertation, University of Washington. Instrument: GPS. Time Period: Dec. 5, 1994 to Dec. 6, 1996. Sample Points: 88. Units: meters per year.
VELMAP: Siple Dome 1996-1997 (velmap_siple_dome_1996_1997)
Scambos, T., B. Raup, and J. Bohlander. Compilers. 2001. VELMAP: Antarctic ice velocity data. Boulder, Colorado USA: National Snow and Ice Data Center. Digital Media. Available at http://nsidc.org/data/velmap/. Accessed 11 February 2009; Nereson, N. 1998. The Flow history of Siple Dome and Ice Streams C and D, West Antarctica: Inferences from geophysical measurements and ice flow models. Ph.D. dissertation, University of Washington. Instrument: GPS. Time Period: Nov. 22, 1996 to Nov. 19, 1997. Sample Points: 29. Units: meters per year.
VELMAP: Siple Dome 1996-1997 (graded) (velmap_siple_dome_1996_1997_graded)
Scambos, T., B. Raup, and J. Bohlander. Compilers. 2001. VELMAP: Antarctic ice velocity data. Boulder, Colorado USA: National Snow and Ice Data Center. Digital Media. Available at http://nsidc.org/data/velmap/. Accessed 11 February 2009; Nereson, N. 1998. The Flow history of Siple Dome and Ice Streams C and D, West Antarctica: Inferences from geophysical measurements and ice flow models. Ph.D. dissertation, University of Washington. Instrument: GPS. Time Period: Nov. 22, 1996 to Nov. 19, 1997. Sample Points: 29. Units: meters per year.
VELMAP: Siple Dome 1994-1997 (velmap_siple_dome_1994_1997)
Scambos, T., B. Raup, and J. Bohlander. Compilers. 2001. VELMAP: Antarctic ice velocity data. Boulder, Colorado USA: National Snow and Ice Data Center. Digital Media. Available at http://nsidc.org/data/velmap/. Accessed 11 February 2009; Nereson, N. 1998. The Flow history of Siple Dome and Ice Streams C and D, West Antarctica: Inferences from geophysical measurements and ice flow models. Ph.D. dissertation, University of Washington. Instrument: GPS. Time Period: Dec. 5, 1994 to Nov. 19, 1997. Sample Points: 4. Units: meters per year.
VELMAP: Siple Dome 1994-1997 (graded) (velmap_siple_dome_1994_1997_graded)
Scambos, T., B. Raup, and J. Bohlander. Compilers. 2001. VELMAP: Antarctic ice velocity data. Boulder, Colorado USA: National Snow and Ice Data Center. Digital Media. Available at http://nsidc.org/data/velmap/. Accessed 11 February 2009; Nereson, N. 1998. The Flow history of Siple Dome and Ice Streams C and D, West Antarctica: Inferences from geophysical measurements and ice flow models. Ph.D. dissertation, University of Washington. Instrument: GPS. Time Period: Dec. 5, 1994 to Nov. 19, 1997. Sample Points: 4. Units: meters per year.
VELMAP: Ice Stream B 1984-1992 (velmap_streamb_1984_1992)
Scambos, T., B. Raup, and J. Bohlander. Compilers. 2001. VELMAP: Antarctic ice velocity data. Boulder, Colorado USA: National Snow and Ice Data Center. Digital Media. Available at http://nsidc.org/data/velmap/. Accessed 11 February 2009; Whillans, I. M. and C. J. Van Der Veen. 1993. New and improved determinations of velocity of Ice Streams B and C, West Antarctica. Journal of Glaciology 39(133): 483-490. Instrument: satellite positioning (Transit/NavSat). Time Period: 1984-1992. Sample Points: 83. Units: meters per year.
VELMAP: Ice Stream B 1984-1992 (graded) (velmap_streamb_1984_1992_graded)
Scambos, T., B. Raup, and J. Bohlander. Compilers. 2001. VELMAP: Antarctic ice velocity data. Boulder, Colorado USA: National Snow and Ice Data Center. Digital Media. Available at http://nsidc.org/data/velmap/. Accessed 11 February 2009; Whillans, I. M. and C. J. Van Der Veen. 1993. New and improved determinations of velocity of Ice Streams B and C, West Antarctica. Journal of Glaciology 39(133): 483-490. Instrument: satellite positioning (Transit/NavSat). Time Period: 1984-1992. Sample Points: 83. Units: meters per year.
VELMAP: Ice Stream C 1996-1997 (velmap_streamc_1996_1997)
Scambos, T., B. Raup, and J. Bohlander. Compilers. 2001. VELMAP: Antarctic ice velocity data. Boulder, Colorado USA: National Snow and Ice Data Center. Digital Media. Available at http://nsidc.org/data/velmap/. Accessed 11 February 2009; Engelhardt, E. 2001. Ice velocities of Ice Stream C. Boulder, Colorado USA: National Snow and Ice Data Center. Digital Media. Accessed 11 February 2009. Instrument: GPS. Time Period: Nov. 16, 1996 to Jan. 13, 1997. Sample Points: 86. Units: meters per year.
VELMAP: Ice Stream C 1996-1997 (graded) (velmap_streamc_1996_1997_graded)
Scambos, T., B. Raup, and J. Bohlander. Compilers. 2001. VELMAP: Antarctic ice velocity data. Boulder, Colorado USA: National Snow and Ice Data Center. Digital Media. Available at http://nsidc.org/data/velmap/. Accessed 11 February 2009; Engelhardt, E. 2001. Ice velocities of Ice Stream C. Boulder, Colorado USA: National Snow and Ice Data Center. Digital Media. Accessed 11 February 2009. Instrument: GPS. Time Period: Nov. 16, 1996 to Jan. 13, 1997. Sample Points: 86. Units: meters per year.
VELMAP: Ice Stream C 2000-2001 (velmap_streamc_2000_2001)
Scambos, T., B. Raup, and J. Bohlander. Compilers. 2001. VELMAP: Antarctic ice velocity data. Boulder, Colorado USA: National Snow and Ice Data Center. Digital Media. Available at http://nsidc.org/data/velmap/. Accessed 11 February 2009; Engelhardt, E. 2001. Ice velocities of Ice Stream C. Boulder, Colorado USA: National Snow and Ice Data Center. Digital Media. Accessed 11 February 2009. Instrument: GPS. Time Period: Nov. 19, 2000 to Jan. 21, 2001. Sample Points: 92. Units: meters per year.
VELMAP: Ice Stream C 2000-2001 (graded) (velmap_streamc_2000_2001_graded)
Scambos, T., B. Raup, and J. Bohlander. Compilers. 2001. VELMAP: Antarctic ice velocity data. Boulder, Colorado USA: National Snow and Ice Data Center. Digital Media. Available at http://nsidc.org/data/velmap/. Accessed 11 February 2009; Engelhardt, E. 2001. Ice velocities of Ice Stream C. Boulder, Colorado USA: National Snow and Ice Data Center. Digital Media. Accessed 11 February 2009. Instrument: GPS. Time Period: Nov. 19, 2000 to Jan. 21, 2001. Sample Points: 92. Units: meters per year.
VELMAP: Ice Stream D and E 1987-1988 (velmap_streamde_1987_1988)
Scambos, T., B. Raup, and J. Bohlander. Compilers. 2001. VELMAP: Antarctic ice velocity data. Boulder, Colorado USA: National Snow and Ice Data Center. Digital Media. Available at http://nsidc.org/data/velmap/. Accessed 11 February 2009; Bindschadler, R. A., P. Vornberger, D. Blankenship, T. Scambos, and R. Jacobel. 1996. Surface velocity an d mass balance of Ice Streams D and E, West Antarctica. Journal of Glaciology 42(142): 461-475. Instrument: Landsat. Time Period: Jan. 16, 1987 to Dec. 12, 1988. Sample Points: 23482. Units: meters per year.
VELMAP: Ice Stream D and E 1987-1988 (graded) (velmap_streamde_1987_1988_graded)
Scambos, T., B. Raup, and J. Bohlander. Compilers. 2001. VELMAP: Antarctic ice velocity data. Boulder, Colorado USA: National Snow and Ice Data Center. Digital Media. Available at http://nsidc.org/data/velmap/. Accessed 11 February 2009; Bindschadler, R. A., P. Vornberger, D. Blankenship, T. Scambos, and R. Jacobel. 1996. Surface velocity an d mass balance of Ice Streams D and E, West Antarctica. Journal of Glaciology 42(142): 461-475. Instrument: Landsat. Time Period: Jan. 16, 1987 to Dec. 12, 1988. Sample Points: 23482. Units: meters per year.
VELMAP: Lower Ice Stream D 1985-1991 (velmap_streamd_lower_1985_1991)
Scambos, T., B. Raup, and J. Bohlander. Compilers. 2001. VELMAP: Antarctic ice velocity data. Boulder, Colorado USA: National Snow and Ice Data Center. Digital Media. Available at http://nsidc.org/data/velmap/. Accessed 11 February 2009; Bindschadler, R. A., P. Vornberger, D. Blankenship, T. Scambos, and R. Jacobel. 1996. Surface velocity and mass balance of Ice Streams D and E, West Antarctica. Journal of Glaciology 42(142): 461-475. Instrument: Landsat. Time Period: Jan. 24, 1985 to Dec. 12, 1991. Sample Points: 1522. Units: meters per year.
VELMAP: Lower Ice Stream D 1985-1991 (graded) (velmap_streamd_lower_1985_1991_graded)
Scambos, T., B. Raup, and J. Bohlander. Compilers. 2001. VELMAP: Antarctic ice velocity data. Boulder, Colorado USA: National Snow and Ice Data Center. Digital Media. Available at http://nsidc.org/data/velmap/. Accessed 11 February 2009; Bindschadler, R. A., P. Vornberger, D. Blankenship, T. Scambos, and R. Jacobel. 1996. Surface velocity and mass balance of Ice Streams D and E, West Antarctica. Journal of Glaciology 42(142): 461-475. Instrument: Landsat. Time Period: Jan. 24, 1985 to Dec. 12, 1991. Sample Points: 1522. Units: meters per year.
VELMAP: Lower Ice Stream D 1994-1995 (velmap_streamd_lower_1994_1995)
Scambos, T., B. Raup, and J. Bohlander. 2001. VELMAP: Antarctic ice velocity data. Boulder, Colorado USA: National Snow and Ice Data Center. Digital Media. Available at http://nsidc.org/data/velmap/. Accessed 11 February 2009. Instrument: SPOT. Time Period: Jan. 20, 1994 to Dec. 9, 1995. Sample Points: 14659. Units: meters per year.
VELMAP: Lower Ice Stream D 1994-1995 (graded) (velmap_streamd_lower_1994_1995_graded)
Scambos, T., B. Raup, and J. Bohlander. 2001. VELMAP: Antarctic ice velocity data. Boulder, Colorado USA: National Snow and Ice Data Center. Digital Media. Available at http://nsidc.org/data/velmap/. Accessed 11 February 2009. Instrument: SPOT. Time Period: Jan. 20, 1994 to Dec. 9, 1995. Sample Points: 14659. Units: meters per year.
VELMAP: Upper Ice Stream D 1987-1991 (velmap_streamd_upper_1987_1991)
Scambos, T., B. Raup, and J. Bohlander. Compilers. 2001. VELMAP: Antarctic ice velocity data. Boulder, Colorado USA: National Snow and Ice Data Center. Digital Media. Available at http://nsidc.org/data/velmap/. Accessed 11 February 2009; Bindschadler, R. A., P. Vornberger, D. Blankenship, T. Scambos, and R. Jacobel. 1996. Surface velocity and mass balance of Ice Streams D and E, West Antarctica. Journal of Glaciology 42(142): 461-475. Instrument: Landsat. Time Period: Jan. 15, 1987 to Dec. 12, 1991. Sample Points: 3537. Units: meters per year.
VELMAP: Upper Ice Stream D 1987-1991 (graded) (velmap_streamd_upper_1987_1991_graded)
Scambos, T., B. Raup, and J. Bohlander. Compilers. 2001. VELMAP: Antarctic ice velocity data. Boulder, Colorado USA: National Snow and Ice Data Center. Digital Media. Available at http://nsidc.org/data/velmap/. Accessed 11 February 2009; Bindschadler, R. A., P. Vornberger, D. Blankenship, T. Scambos, and R. Jacobel. 1996. Surface velocity and mass balance of Ice Streams D and E, West Antarctica. Journal of Glaciology 42(142): 461-475. Instrument: Landsat. Time Period: Jan. 15, 1987 to Dec. 12, 1991. Sample Points: 3537. Units: meters per year.
VELMAP: Lower Ice Stream D and E 1987-1989 (velmap_streamde_lower_1987_1989)
Scambos, T., B. Raup, and J. Bohlander. Compilers. 2001. VELMAP: Antarctic ice velocity data. Boulder, Colorado USA: National Snow and Ice Data Center. Digital Media. Available at http://nsidc.org/data/velmap/. Accessed 11 February 2009; Bindschadler, R. A., P. Vornberger, D. Blankenship, T. Scambos, and R. Jacobel. 1996. Surface velocity an d mass balance of Ice Streams D and E, West Antarctica. Journal of Glaciology 42(142): 461-475. Instrument: Landsat. Time Period: Jan. 15, 1987 to Feb. 15, 1989. Sample Points: 5831. Units: meters per year.
VELMAP: Lower Ice Stream D and E 1987-1989 (graded) (velmap_streamde_lower_1987_1989_graded)
Scambos, T., B. Raup, and J. Bohlander. Compilers. 2001. VELMAP: Antarctic ice velocity data. Boulder, Colorado USA: National Snow and Ice Data Center. Digital Media. Available at http://nsidc.org/data/velmap/. Accessed 11 February 2009; Bindschadler, R. A., P. Vornberger, D. Blankenship, T. Scambos, and R. Jacobel. 1996. Surface velocity an d mass balance of Ice Streams D and E, West Antarctica. Journal of Glaciology 42(142): 461-475. Instrument: Landsat. Time Period: Jan. 15, 1987 to Feb. 15, 1989. Sample Points: 5831. Units: meters per year.
VELMAP: Lower Ice Stream D and E 1987-1990 (velmap_streamde_lower_1987_1990)
Scambos, T., B. Raup, and J. Bohlander. Compilers. 2001. VELMAP: Antarctic ice velocity data. Boulder, Colorado USA: National Snow and Ice Data Center. Digital Media. Available at http://nsidc.org/data/velmap/. Accessed 11 February 2009; Bindschadler, R. A., P. Vornberger, D. Blankenship, T. Scambos, and R. Jacobel. 1996. Surface velocity an d mass balance of Ice Streams D and E, West Antarctica. Journal of Glaciology 42(142): 461-475. Instrument: Landsat. Time Period: Jan. 15, 1987 to Feb. 5, 1990. Sample Points: 9554. Units: meters per year.
VELMAP: Lower Ice Stream D and E 1987-1990 (graded) (velmap_streamde_lower_1987_1990_graded)
Scambos, T., B. Raup, and J. Bohlander. Compilers. 2001. VELMAP: Antarctic ice velocity data. Boulder, Colorado USA: National Snow and Ice Data Center. Digital Media. Available at http://nsidc.org/data/velmap/. Accessed 11 February 2009; Bindschadler, R. A., P. Vornberger, D. Blankenship, T. Scambos, and R. Jacobel. 1996. Surface velocity an d mass balance of Ice Streams D and E, West Antarctica. Journal of Glaciology 42(142): 461-475. Instrument: Landsat. Time Period: Jan. 15, 1987 to Feb. 5, 1990. Sample Points: 9554. Units: meters per year.
VELMAP: Lower Ice Stream D and E 1989-1990 (velmap_streamde_lower_1989_1990)
Scambos, T., B. Raup, and J. Bohlander. Compilers. 2001. VELMAP: Antarctic ice velocity data. Boulder, Colorado USA: National Snow and Ice Data Center. Digital Media. Available at http://nsidc.org/data/velmap/. Accessed 11 February 2009; Bindschadler, R. A., P. Vornberger, D. Blankenship, T. Scambos, and R. Jacobel. 1996. Surface velocity an d mass balance of Ice Streams D and E, West Antarctica. Journal of Glaciology 42(142): 461-475. Instrument: Landsat. Time Period: Feb. 15, 1989 to Feb. 5, 1990. Sample Points: 2273. Units: meters per year.
VELMAP: Lower Ice Stream D and E 1989-1990 (graded) (velmap_streamde_lower_1989_1990_graded)
Scambos, T., B. Raup, and J. Bohlander. Compilers. 2001. VELMAP: Antarctic ice velocity data. Boulder, Colorado USA: National Snow and Ice Data Center. Digital Media. Available at http://nsidc.org/data/velmap/. Accessed 11 February 2009; Bindschadler, R. A., P. Vornberger, D. Blankenship, T. Scambos, and R. Jacobel. 1996. Surface velocity an d mass balance of Ice Streams D and E, West Antarctica. Journal of Glaciology 42(142): 461-475. Instrument: Landsat. Time Period: Feb. 15, 1989 to Feb. 5, 1990. Sample Points: 2273. Units: meters per year.
VELMAP: Lower Ice Stream E 1987-1992 (velmap_streame_lower_1987_1992)
Scambos, T., B. Raup, and J. Bohlander. Compilers. 2001. VELMAP: Antarctic ice velocity data. Boulder, Colorado USA: National Snow and Ice Data Center. Digital Media. Available at http://nsidc.org/data/velmap/. Accessed 11 February 2009; Bindschadler, R. A., P. Vornberger, D. Blankenship, T. Scambos, and R. Jacobel. 1996. Surface velocity an d mass balance of Ice Streams D and E, West Antarctica. Journal of Glaciology 42(142): 461-475. Instrument: Landsat. Time Period: Jan. 17, 1987 to Jan. 31, 1992. Sample Points: 20916. Units: meters per year.
VELMAP: Lower Ice Stream E 1987-1992 (graded) (velmap_streame_lower_1987_1992_graded)
Scambos, T., B. Raup, and J. Bohlander. Compilers. 2001. VELMAP: Antarctic ice velocity data. Boulder, Colorado USA: National Snow and Ice Data Center. Digital Media. Available at http://nsidc.org/data/velmap/. Accessed 11 February 2009; Bindschadler, R. A., P. Vornberger, D. Blankenship, T. Scambos, and R. Jacobel. 1996. Surface velocity an d mass balance of Ice Streams D and E, West Antarctica. Journal of Glaciology 42(142): 461-475. Instrument: Landsat. Time Period: Jan. 17, 1987 to Jan. 31, 1992. Sample Points: 20916. Units: meters per year.
VELMAP: Upper Ice Stream E 1987-1992 (velmap_streame_upper_1987_1992)
Scambos, T., B. Raup, and J. Bohlander. Compilers. 2001. VELMAP: Antarctic ice velocity data. Boulder, Colorado USA: National Snow and Ice Data Center. Digital Media. Available at http://nsidc.org/data/velmap/. Accessed 11 February 2009; Bindschadler, R. A., P. Vornberger, D. Blankenship, T. Scambos, and R. Jacobel. 1996. Surface velocity an d mass balance of Ice Streams D and E, West Antarctica. Journal of Glaciology 42(142): 461-475. Instrument: Landsat. Time Period: Jan. 17, 1987 to Jan. 31, 1992. Sample Points: 8267. Units: meters per year.
VELMAP: Upper Ice Stream E 1987-1992 (graded) (velmap_streame_upper_1987_1992_graded)
Scambos, T., B. Raup, and J. Bohlander. Compilers. 2001. VELMAP: Antarctic ice velocity data. Boulder, Colorado USA: National Snow and Ice Data Center. Digital Media. Available at http://nsidc.org/data/velmap/. Accessed 11 February 2009; Bindschadler, R. A., P. Vornberger, D. Blankenship, T. Scambos, and R. Jacobel. 1996. Surface velocity an d mass balance of Ice Streams D and E, West Antarctica. Journal of Glaciology 42(142): 461-475. Instrument: Landsat. Time Period: Jan. 17, 1987 to Jan. 31, 1992. Sample Points: 8267. Units: meters per year.
VELMAP: Ice Stream F 1987-1990 (velmap_streamf_1987_1990)
Scambos, T., B. Raup, and J. Bohlander. 2001. VELMAP: Antarctic ice velocity data. Boulder, Colorado USA: National Snow and Ice Data Center. Digital Media. Available at http://nsidc.org/data/velmap/. Accessed 11 February 2009. Instrument: Landsat. Time Period: Jan. 14, 1987 to Feb. 5, 1990. Sample Points: 5158. Units: meters per year.
VELMAP: Ice Stream F 1987-1990 (graded) (velmap_streamf_1987_1990_graded)
Scambos, T., B. Raup, and J. Bohlander. 2001. VELMAP: Antarctic ice velocity data. Boulder, Colorado USA: National Snow and Ice Data Center. Digital Media. Available at http://nsidc.org/data/velmap/. Accessed 11 February 2009. Instrument: Landsat. Time Period: Jan. 14, 1987 to Feb. 5, 1990. Sample Points: 5158. Units: meters per year.
VELMAP: Sulzberger Ice Shelf 1986-1989 (velmap_sulzberger_1986_1989)
Scambos, T., B. Raup, and J. Bohlander. 2001. VELMAP: Antarctic ice velocity data. Boulder, Colorado USA: National Snow and Ice Data Center. Digital Media. Available at http://nsidc.org/data/velmap/. Accessed 11 February 2009. Instrument: Landsat. Time Period: Dec. 11, 1986 to Mar. 16, 1989. Sample Points: 2430. Units: meters per year.
VELMAP: Sulzberger Ice Shelf 1986-1989 (graded) (velmap_sulzberger_1986_1989_graded)
Scambos, T., B. Raup, and J. Bohlander. 2001. VELMAP: Antarctic ice velocity data. Boulder, Colorado USA: National Snow and Ice Data Center. Digital Media. Available at http://nsidc.org/data/velmap/. Accessed 11 February 2009. Instrument: Landsat. Time Period: Dec. 11, 1986 to Mar. 16, 1989. Sample Points: 2430. Units: meters per year.
VELMAP: Thwaites Glacier 1988-1990 (velmap_thwaites_1988_1990)
Scambos, T., B. Raup, and J. Bohlander. 2001. VELMAP: Antarctic ice velocity data. Boulder, Colorado USA: National Snow and Ice Data Center. Digital Media. Available at http://nsidc.org/data/velmap/. Accessed 11 February 2009. Instrument: Landsat. Time Period: Jan. 22, 1988 to Jan. 11, 1990. Sample Points: 2800. Units: meters per year.
VELMAP: Thwaites Glacier 1988-1990 (graded) (velmap_thwaites_1988_1990_graded)
Scambos, T., B. Raup, and J. Bohlander. 2001. VELMAP: Antarctic ice velocity data. Boulder, Colorado USA: National Snow and Ice Data Center. Digital Media. Available at http://nsidc.org/data/velmap/. Accessed 11 February 2009. Instrument: Landsat. Time Period: Jan. 22, 1988 to Jan. 11, 1990. Sample Points: 2800. Units: meters per year.
VELMAP: Terra Nova Bay 1991-1994 (velmap_tnb_1991_1994)
Scambos, T., B. Raup, and J. Bohlander. Compilers. 2001. VELMAP: Antarctic ice velocity data. Boulder, Colorado USA: National Snow and Ice Data Center. Digital Media. Available at http://nsidc.org/data/velmap/. Accessed 11 February 2009; Frezzotti M., A. Capra, and L. Vittuari. 1998. Comparison between glacier ice velocities inferred from GPS and sequential satellite images. Annals of Glaciology 27: 54-60. Other citations. Instrument: GPS. Time Period: Dec. 21, 1991 to Feb. 1, 1994. Sample Points: 15. Units: meters per year.
VELMAP: Terra Nova Bay 1991-1994 (graded) (velmap_tnb_1991_1994_graded)
Scambos, T., B. Raup, and J. Bohlander. Compilers. 2001. VELMAP: Antarctic ice velocity data. Boulder, Colorado USA: National Snow and Ice Data Center. Digital Media. Available at http://nsidc.org/data/velmap/. Accessed 11 February 2009; Frezzotti M., A. Capra, and L. Vittuari. 1998. Comparison between glacier ice velocities inferred from GPS and sequential satellite images. Annals of Glaciology 27: 54-60. Other citations. Instrument: GPS. Time Period: Dec. 21, 1991 to Feb. 1, 1994. Sample Points: 15. Units: meters per year.
VELMAP: Vega Island 1998-2000 (velmap_vega_1998_2000)
Scambos, T., B. Raup, and J. Bohlander. Compilers. 2001. VELMAP: Antarctic ice velocity data. Boulder, Colorado USA: National Snow and Ice Data Center. Digital Media. Available at http://nsidc.org/data/velmap/. Accessed 11 February 2009; Skvarca, P., W. Rack and H. Rott. 1999. 34 year satellite time series to monitor characteristics, extent and dynamics of Larsen B Ice Shelf, Antarctic Peninsula. Annals of Glaciology 29: 255-260. Other citations. Instrument: GPS. Time Period: Feb. 12, 1998 to Feb. 1, 2000. Sample Points: 14. Units: meters per year.
VELMAP: Vega Island 1998-2000 (graded) (velmap_vega_1998_2000_graded)
Scambos, T., B. Raup, and J. Bohlander. Compilers. 2001. VELMAP: Antarctic ice velocity data. Boulder, Colorado USA: National Snow and Ice Data Center. Digital Media. Available at http://nsidc.org/data/velmap/. Accessed 11 February 2009; Skvarca, P., W. Rack and H. Rott. 1999. 34 year satellite time series to monitor characteristics, extent and dynamics of Larsen B Ice Shelf, Antarctic Peninsula. Annals of Glaciology 29: 255-260. Other citations. Instrument: GPS. Time Period: Feb. 12, 1998 to Feb. 1, 2000. Sample Points: 14. Units: meters per year.
South Pole snow pit, 1988 and 1989 (nsidc-0086)
Mayewski, P. and S. Whitlow. 2000. South Pole snow pit, 1988 and 1989. Boulder, Colorado USA: National Snow and Ice Data Center. Digital media. Available at http://nsidc.org/data/nsidc-0086.html. Accessed 19 January 2009. Background: Information from 6-meter snow pits dug close to the South Pole in austral summer 1988-1989 by the Glacier Research Group of the University of New Hampshire (location - 38 km on grid 90 from South Pole station - eastern margin of clean air sector) are available. Major ion chemistry (Na, K, Mg, Ca, Cl, NO3, SO4), oxygen isotopes (I8O), H2O2, and beta from a 6-meter snow pit covering the period 1955 to 1989 are included. Major ion chemistry for a series of surface snow samples were also collected on the traverse to the pit. Sample Points: 1.
Dominion Range snow pit and ice core, 1984 and 1985 (nsidc-0087)
Mayewski, P. and S. Whitlow. 2000. Dominion Range snow pit and ice core, 1984 and 1985. Boulder, Colorado USA: National Snow and Ice Data Center. Digital media. Available at http://nsidc.org/data/nsidc-0087.html. Accessed 19 January 2009. Background: Information from snow pits and an ice core were collected at Dominion Range (location - 166 10' East, 85 15' South, elevation - 2,700m) in 1984-1985. The 6 meter snow pit was dug and sampled in 1984-1985 with a 3 cm sampling interval. Four 1 meter snow pits were dug and sampled in 1984-1985 with a 3 cm sampling interval. One core was drilled during the austral summer 1984-1985 with a depth of 160 meters. Chemistry and density data were collected from the 1 meter pits. Chemistry, beta profile and density data were collected from the 6 meter snow pits. Chemistry (Na NH4, K, Mg, Ca, Cl, NO3, SO4, MSA), particles and a lead-210 profile were collected from the ice core. Sample Points: 6.
Newall Glacier snow pit and ice core, 1987 to 1989 (nsidc-0088)
Mayewski, P. and S. Whitlow. 2000. Newall Glacier snow pit and ice core, 1987 to 1989. Boulder, Colorado USA: National Snow and Ice Data Center. Digital media. Available at http://nsidc.org/data/nsidc-0088.html. Accessed 19 January 2009. Background: Snow pit and ice core data from the Newall Glacier (location - 162 30' East, 77 35' South) were collected during 1987 and 1988. These include information on chemistry, Beta profiles and stratigraphy. Ice cores were collected during the austral summer of 1988-1989 and contain information on chemistry, Pb-210 profiles, density profiles and temperature profiles. Core A was 175 meters long and core B was 150 meters long. The snow pits were dug and sampled by the Glacier Research Group (GRG), using established protocols to prevent contamination. The samples for major ion chemistry remained frozen until melted for analysis in the GRG lab, located at the University of New Hampshire (UNH), and all core processing was done by GRG established protocols to prevent contamination. Major ions were analyzed using suppressed ion chromatography. Sample Points: 4.
Central West Antarctic glaciochemistry from ice cores (nsidc-0093)
Reusch, D. 2001. Central West Antarctic glaciochemistry from ice cores. Boulder, Colorado USA: National Snow and Ice Data Center. Digital Media. Available at http://nsidc.org/data/nsidc-0093.html. Accessed 20 January 2009. Background: Glaciochemical and accumulation rate records developed from four ice cores in central West Antarctica are used to reconstruct former atmospheric circulation patterns in this region for the last 40 years with extended records (150-250 years) at two sites. The sites lie on a 200 km traverse from 82 degrees 22 minutes south, 119 degrees 17 minutes west to 81 degrees 22 minutes south, 107 degrees 17 minutes west, gaining elevation from 950 to 1930 m. The glaciochemical records represent the major ionic species present in Antarctic snow: sodium, potassium, magnesium, calcium, chloride, nitrate, and sulfate. Time Period: austral summer 1994-1995. Sample Points: 4.
Firn air isotope and temperature measurements from Siple Dome and South Pole (nsidc-0098)
Severinghaus, J. P., A. Grachev, and M. Battle. 2001. Firn air isotope and temperature measurements from Siple Dome and South Pole. Boulder, Colorado USA: National Snow and Ice Data Center. Digital Media. Available at http://nsidc.org/data/nsidc-0098.html. Accessed 20 January 2009. Background: This data set includes d15N, d18O/2, dO2/N2/4, d40Ar/4, d38/Ar/2, d84Kr/48, and d132Xe/96 values for air drawn from the top 15 to 50 m of firn at the South Pole (summer and winter 1998) and a site at Siple Dome (summers 1996 and 1998). Data also include related firn temperature measurements. The objective of this research was to better understand thermal fractionation processes affecting records of atmospheric history from firn and ice core gases. Recent work (e.g., Severinghaus and Brook, 1999) has exploited trapped air in ice and deep firn as a record of past atmospheric composition and climate change. Interpretation of these paleoclimate archives is complicated by artifacts of thermal diffusion, a process in which heavier gases migrate down temperature gradients toward colder regions in the firn. Seasonal temperature change at the snow surface creates strong temperature gradients in the top few meters of the firn, which cause isotopic fractionation of firn gases. A specific goal of this research is to identify any long-term effects of seasonal temperature fluctuations on firn air isotopic anomalies. Sample Points: 2. Measurement Depth: 15-50 m.
Snow and firn temperature and permeability measurements from Siple Dome, Antarctica (nsidc-0100)
Albert, M. R. 2001. Snow and firn temperature and permeability measurements from Siple Dome, Antarctica. Boulder, Colorado USA: National Snow and Ice Data Center. Digital media. Available at http://nsidc.org/data/nsidc-0100.html. Accessed 22 January 2009. Background: This data set includes measurements of snow and firn temperature and permeability collected between November 1998 and June 1999 at Siple Dome. The physical characteristics of snow determine the nature of air-snow exchange processes, which in turn affect chemical records in ice cores. Thus a better understanding of the physical properties of snow will improve interpretation of ice core records of atmospheric composition. Sample Points: 3.
Tephra in Siple and Taylor Dome ice cores (nsidc-0110)
Dunbar, N. 2002. Tephra in Siple and Taylor Dome ice cores. Boulder, Colorado USA: National Snow and Ice Data Center. Digital media. Available at http://nsidc.org/data/nsidc-0110.html. Accessed 22 January 2008. Background: This data set consists of electron microprobe geochemical analyses of glass shards sampled from Siple Dome and Taylor Dome ice cores during the 1999-2000 field season. Sample Points: 2.
Micrometeorites from the South Pole water well (nsidc-0113)
Taylor, S. 2002. Micrometeorites from the South Pole water well. Boulder, Colorado USA: National Snow and Ice Data Center. Digital media. Available at http://nsidc.org/data/nsidc-0113.html. Accessed 22 January 2009. Background: Micrometeorites dated between 1100 A.D. to 1500 A.D. were collected from the bottom of the South Pole Water Well in December 1995. Element analyses of 181 cosmic glass spherule and micrometeorite samples as well as Scanning Electron Microscope (SEM) images of the spherules and micrometeorites are provided.
Taylor Dome ice core data (nsidc-0132)
Steig, E. and J. White. 2003. Taylor Dome ice core data. Boulder, Colorado USA: National Snow and Ice Data Center in association with the World Data Center (WCC) for Paleoclimatology at NOAA-NGDC. Digital Media. Available at http://nsidc.org/data/nsidc-0132.html. Accessed 22 January 2009. Background: The collection site is Taylor Dome, an ice-accumulation area on the East Antarctic ice sheet. The dome is a ridge about 20 x 80 km, which lies inland of the Transantarctic Mountains. Deep drilling by the Polar Ice Coring Office (PICO) at Taylor Dome reached bedrock at a depth of 554 meters during the 1993-1994 austral summer season. This data set includes mesurements of beryllium-10, oxygen isotopes, and deuterium isotopes. These data were produced at the University of Washington from samples obtained in the field and via the University of New Hampshire automatic melting system. For beryllium, deuterium, and 20-cm oxygen isotope data, the st9810 ice age (kyB1950) timescale is used. For 0.5- to 1-m oxygen isotope data, the st9507 is used.
Roosevelt Island ice core density and beta count data (nsidc-0139)
Conway, H. 1998. Roosevelt Island ice core density and beta count data. Boulder, Colorado USA: National Snow and Ice Data Center. Digital media. Available at http://nsidc.org/data/nsidc-0139.html. Accessed 23 January 2009. Background: This data set measures the radioactive decay of nuclear material from Northern and Southern hemisphere nuclear testing. Firn cores were taken from three locations on Roosevelt Island, an ice dome within the Ross Ice Shelf, and were measured at increasing depth for density in kilograms per cubic meter, and for beta counts per hour per kilogram. The data were collected between November and December of 1997. Measurements were taken incrementally down to approximately 17 meters for each of the three cores.
Sulfate-based volcanic record from South Pole ice core (nsidc-0215)
Cole-Dai, J. 2004. Sulfate-based volcanic record from South Pole ice core. Boulder, Colorado USA: National Snow and Ice Data Center. Digital media. Available at http://nsidc.org/data/nsidc-0215.html. Accessed 23 January 2009. Background: This data set contains concentrations of soluble chemical species (ions) within a 120 m ice core retrieved at the South Pole station in 2001. The ice core was dated with annual resolution using annual layer counting. Investigators measured chemical species, ions, and volcanic deposits found in the cores. The analysis was conducted at South Dakota State University between 2001 and 2003.
Atmospheric CO2 and climate: Byrd ice core, Antarctica (nsidc-0314)
Ahn, J. and E. J. Brook. 2007. Atmospheric CO2 and climate: Byrd ice core, Antarctica. Boulder, Colorado USA: National Snow and Ice Data Center. Digital Media. Available at http://nsidc.org/data/nsidc-0314.html. Accessed 24 January 2009. Background: Reconstructions of ancient atmospheric CO2 variations help us better understand how the global carbon cycle and climate are linked. Here we compare CO2 variations on millennial time scales between 20,000 and 90,000 years with an Antarctic temperature proxy and records of abrupt climate change in the northern hemisphere. CO2 and Antarctic temperature are positively correlated over millennial-scale climate cycles, implying a strong connection to southern ocean processes. Evidence from marine sediment proxies indicates that CO2 rose most rapidly when North Atlantic Deep Water shoaled and stratification in the Southern Ocean was reduced. These increases in CO2 occurred during stadial (cold) periods in the northern hemisphere, several thousand years before abrupt warming events in Greenland. Time Period: 1968. Sample Points: 1.
Methyl chloride measurements from the Siple Dome A deep core, Antarctica (nsidc-0356)
Saltzman, E., M. Aydin, and M. Williams. 2008. Methyl chloride measurements from the Siple Dome A deep core, Antarctica. Boulder, Colorado USA: National Snow and Ice Data Center. Digital Media. Available at http://nsidc.org/data/nsidc-0356.html. Accessed 24 January 2009. Background: This data set is an analysis of methyl chloride concentration measured in air extracted from ice core samples from the Siple Dome A deep core in West Antarctica. In total, forty six (46) ice samples, approximately 10-15 cm in length, were analyzed in this study. Time Period: 1996-1999.
Antarctic 5-km digital elevation model from ERS-1 altimetry: contours (bamber_dem_contours)
Bamber, J. L. and R. A. Bindschadler. 1997. An improved elevation dataset for climate and ice-sheet modelling: validation with satellite imagery. Annals of Glaciology 25:438-444.; Bamber, J. L. and R. A. Bindschadler. 1997. Antarctic 5-km digital elevation model from ERS-1 altimetry. Boulder, Colorado USA: National Snow and Ice Data Center. Digital Media. Available at http://nsidc.org/data/nsidc-0076.html. Accessed 03 July 2008. Background: This data set provides a digital elevation model (DEM) for Antarctica to 81.5 degrees south latitude, at a resolution of 5 km. Approximately twenty million data points were used to generate this data set. Data points were derived from European Remote Sensing Satellite-1 (ERS-1) radar altimetry during the geodetic phase from March 1994 to May 1995. The improved density in coverage and resolution, compared with past satellite altimetry missions, provides better detection of topographic detail such as surface undulations, ice streams, grounding zones, and interstream ridges. This DEM is viewable here as contours of OSU91A elevations (m).
BEDMAP - bed topography of the Antarctic: contours (bedmap_contours)
Lythe, M. B., D. G. Vaughan, and the BEDMAP Consortium. 2000. BEDMAP - bed topography of the Antarctic. Cambridge, United Kingdom: British Antarctic Survey. Digital Media. Available at http://www.antarctica.ac.uk//bas_research/data/access/bedmap/. Accessed 28 June 2008. Background: The BEDMAP project was conceived as an attempt to rationalise the coverage of ice thickness measurements over Antarctica, collect the data together and produce a new topographic model of the bed of the Antarctic Ice Sheet, to provide a new basis for all aspects of Antarctic geoscience. Includes the entire area south of 60 degrees south latitude. Resolution: 5 km. Time Period: 1951-1999. Sources: ground-based and airborne surveys, primarily from radar and seismic sounding as well as gravimetric measurements. Elevations are relative to the OSU91A geoid. This DEM is viewable here as contours of OSU91A elevations (m).
BEDMAP - bed topography of the Antarctic: at or above sea level (bedmap_above_sea_level)
Lythe, M. B., D. G. Vaughan, and the BEDMAP Consortium. 2000. BEDMAP - bed topography of the Antarctic. Cambridge, United Kingdom: British Antarctic Survey. Digital Media. Available at http://www.antarctica.ac.uk//bas_research/data/access/bedmap/. Accessed 28 June 2008. Background: The BEDMAP project was conceived as an attempt to rationalise the coverage of ice thickness measurements over Antarctica, collect the data together and produce a new topographic model of the bed of the Antarctic Ice Sheet, to provide a new basis for all aspects of Antarctic geoscience. Includes the entire area south of 60 degrees south latitude. Resolution: 5 km. Time Period: 1951-1999. Sources: ground-based and airborne surveys, primarily from radar and seismic sounding as well as gravimetric measurements. Elevations are relative to the OSU91A geoid.
GLAS/ICESat 500 m laser altimetry digital elevation model of Antarctica: contours (glas_dem_contours)
DiMarzio, J., A. Brenner, R. Schutz, C. A. Shuman, and H. J. Zwally. 2007. GLAS/ICESat 500 m laser altimetry digital elevation model of Antarctica. Boulder, Colorado USA: National Snow and Ice Data Center. Digital media. Available at http://nsidc.org/data/nsidc-0304.html. Accessed 03 July 2008. Background: This digital elevation model (DEM) of Antarctica is derived from Geoscience Laser Altimeter System (GLAS)/Ice, Cloud, and land Elevation Satellite (ICESat) laser altimetry profile data and provides new surface elevation grids of the ice sheets and coastal areas, with greater latitudinal extent and fewer slope-related effects than radar altimetry. This DEM is generated from the first seven operational periods (from February 2003 through June 2005) of the GLAS instrument. The grid is provided at 500 m spacing and covers all of Antarctica north of 86 degrees S. Elevations are reported as centimeters above the WGS84 ellipsoid. This DEM is viewable here as a series of contours.
Radarsat Antarctic Mapping Project digital elevation model version 2: contours (ramp_dem_contours)
Liu, H., K. Jezek, B. Li, and Z. Zhao. 2001. Radarsat Antarctic Mapping Project digital elevation model version 2. Boulder, CO, USA: National Snow and Ice Data Center. Digital media. Available at http://nsidc.org/data/nsidc-0082.html. Accessed on 06 June 2008. Background: The high-resolution (200 m) Radarsat Antarctic Mapping Project (RAMP) Digital Elevation Model (DEM) combines topographic data from a variety of sources to provide consistent coverage of all of Antarctica. Version 2 improves upon the original version by incorporating new topographic data, error corrections, extended coverage, and other modifications. The DEM incorporates topographic data from satellite radar altimetry, airborne radar surveys, the recently-updated Antarctic Digital Database (version 2), and large-scale topographic maps from the U.S. Geological Survey (USGS) and the Australian Antarctic Division. Data were collected between the 1940s and present, with most collected during the 1980s and 1990s. Although the RAMP DEM was created to aid in processing RAMP radar data, it does not utilize any RAMP radar data. This DEM is viewable here as a series of WGS84 elevation (m) contours.
Antarctic snow accumulation: Arthern et al. 2006 (contours) (accumulation_arthern_contours)
Arthern, R. J., D. P. Winebrenner, and D. G. Vaughan. 2006. Antarctic snow accumulation mapped using polarization of 4.3-cm wavelength microwave emission. Journal of Geophysical Research. 111, D06107, doi:10.1029/2004JD005667. Data provided by the British Antarctic Survery, Cambridge, United Kingdom. Available at http://www.antarctica.ac.uk//bas_research/data/online_resources/snow_accumulation/. Accessed 27 October 2006. Background: This map of Antarctic snow accumulation is derived from a compilation of field measurements. Satellite observations from AMSR-E and AVHRR are used to guide the interpolation. Values for locations subject to snow melt may be unreliable. From this map can be obtained a value of 143 +/- 4 mm per year snow water equivalent for the average rate of snow accumulation upon the grounded ice sheet of Antarctica. Resolution: 125 km.
Antarctic snow accumulation: Monaghan et al. 2006 (contours) (accumulation_monaghan_contours)
Monaghan, A. J., D. H. Bromwich, and S.-H. Wang. 2006. Recent trends in Antarctic snow accumulation from Polar MM5 simulations. Philisophical Transactions of the Royal Society A 364: 1683-1708. Data provided by the Ohio State University, Byrd Polar Research Center, Polar Meteorology Group, Columbus, Ohio USA. Available at http://polarmet.mps.ohio-state.edu/PolarMet/ant_hindcast.html. Accessed 10 August 2008. Background: Polar MM5, a mesoscale atmospheric model optimized for use over polar ice sheets, is employed to simulate Antarctic accumulation in recent decades by subtracting model-simulated precipitation from sublimation. Negative values therefore indicate areas where sublimation is greater than precipitation. Resolution: 60 km.
Antarctic surface mass balance: Van de Berg et al. 2005 (contours) (surface_mass_balance_van_de_berg_contours)
Van de Berg, W. J., M. R. van den Broeke, C. H. Reijmer, and E. van Meijgaard. 2005. Characteristics of the Antarctic surface mass balance, 1958-2002, using a regional atmospheric climate model. Annals of Glaciology 41:97-104. Data provided by Utrecht University, Utrecht, Netherlands. Accessed 10 August 2008. Background: Regional Atmospheric Climate Model version 2 (RACMO2/ANT) simulations with initial and boundary conditions provided by the European Centre for Medium-Range Weather Forecasts (ECMWF) 40-year Reanalysis (ERA-40). Resolution: 60 km. Time Period: 1958-2002. RACMO2/ANT is employed to simulate Antarctic specific surface mass balance (SSMB) in recent decades as the sum of modeled solid precipitation, sublimation/deposition, and melt.
coastlines (coastlines)
Four separate layers are used to map coastlines in the Southern Hemisphere: (1.) the Gridded Population of the World Version 3 (GPWv3) for everything but Antarctica; and NSIDC's MODIS Mosaic of Antarctica (MOA)-based polygons for Antarctica's (2.) islands, (3.) grounding line or continent (excludes the ice shelves), and (4.) coastline (includes the ice shelves). These sources are documented and cited in their respective layers below.
coastlines (excluding Antarctica) (coastlines_excluding_antarctica)
Center for International Earth Science Information Network (CIESIN), Columbia University; and Centro Internacional de Agricultura Tropical (CIAT). 2005. Gridded Population of the World Version 3 (GPWv3): Coastlines. Palisades, NY, USA: Socioeconomic Data and Applications Center (SEDAC), Columbia University. Available at http://sedac.ciesin.columbia.edu/gpw. 19 January 2007. Background: Coastlines derived from the Gridded Population of the World (GPW) land area grid at 2.5 arc-minute resolution. Permanent ice and all but large lakes have been merged with neighbouring polygons to make a layer more appropriate for cartographic visualization of the data. Does not include Antarctica.
Antarctic coastline (includes ice shelves) (antarctica_coastline)
Bohlander, J. and T. Scambos. 2007. Antarctic coastlines and grounding line derived from MODIS Mosaic of Antarctica (MOA). Boulder, Colorado USA: National Snow and Ice Data Center. Digital media. Accessed 24 April 2008. Background: These outlines were hand-digitized from the Moderate-resolution Imaging Spectroradiometer (MODIS) mosaic of Antarctica (MOA) image map produced and distributed by the National Snow and Ice Data Center (NSIDC) at: http://nsidc.org/data/nsidc-0280.html. The coastline includes the ice shelves surrounding Antarctica while the grounding line excludes them. Coastlines for islands surrounding Antarctica are provided separately from the rest of Antarctica's grounding line.
Antarctic grounding line (excludes ice shelves) (antarctica_grounding_line)
Bohlander, J. and T. Scambos. 2007. Antarctic coastlines and grounding line derived from MODIS Mosaic of Antarctica (MOA). Boulder, Colorado USA: National Snow and Ice Data Center. Digital media. Accessed 24 April 2008. Background: These outlines were hand-digitized from the Moderate-resolution Imaging Spectroradiometer (MODIS) mosaic of Antarctica (MOA) image map produced and distributed by the National Snow and Ice Data Center (NSIDC) at: http://nsidc.org/data/nsidc-0280.html. The coastline includes the ice shelves surrounding Antarctica while the grounding line excludes them. Coastlines for islands surrounding Antarctica are provided separately from the rest of Antarctica's grounding line.
Antarctic island coastlines (antarctica_islands_coastlines)
Bohlander, J. and T. Scambos. 2007. Antarctic coastlines and grounding line derived from MODIS Mosaic of Antarctica (MOA). Boulder, Colorado USA: National Snow and Ice Data Center. Digital media. Accessed 24 April 2008. Background: These outlines were hand-digitized from the Moderate-resolution Imaging Spectroradiometer (MODIS) mosaic of Antarctica (MOA) image map produced and distributed by the National Snow and Ice Data Center (NSIDC) at: http://nsidc.org/data/nsidc-0280.html. The coastline includes the ice shelves surrounding Antarctica while the grounding line excludes them. Coastlines for islands surrounding Antarctica are provided separately from the rest of Antarctica's grounding line.
countries (country_borders)
Three separate layers are used to map countries in the Southern Hemisphere: (1.) the Gridded Population of the World Version 3 (GPWv3) for everything but Antarctica; and NSIDC's MODIS Mosaic of Antarctica (MOA)-based polygons for Antarctica's (2.) grounding line or continent (excludes the ice shelves) and (3.) island coastlines. These sources are documented and cited in their respective layers below.
countries (excluding Antarctica) (country_borders_excluding_antarctica)
Center for International Earth Science Information Network (CIESIN), Columbia University; and Centro Internacional de Agricultura Tropical (CIAT). 2005. Gridded Population of the World Version 3 (GPWv3): National Boundaries. Palisades, NY, USA: Socioeconomic Data and Applications Center (SEDAC), Columbia University. Available at http://sedac.ciesin.columbia.edu/gpw. 19 January 2007. Background: National boundaries derived from the Gridded Population of the World (GPW) country-level land area grids at 2.5 arc-minute resolution. Permanent ice and all but large lakes have been merged with neighbouring polygons to make a layer more appropriate for cartographic visualization of the data. Does not include Antarctica.
Antarctic grounding line (excludes ice shelves) (antarctica_country_border)
Bohlander, J. and T. Scambos. 2007. Antarctic coastlines and grounding line derived from MODIS Mosaic of Antarctica (MOA). Boulder, Colorado USA: National Snow and Ice Data Center. Digital media. Accessed 24 April 2008. Background: These outlines were hand-digitized from the Moderate-resolution Imaging Spectroradiometer (MODIS) mosaic of Antarctica (MOA) image map produced and distributed by the National Snow and Ice Data Center (NSIDC) at: http://nsidc.org/data/nsidc-0280.html. The coastline includes the ice shelves surrounding Antarctica while the grounding line excludes them. Coastlines for islands surrounding Antarctica are provided separately from the rest of Antarctica's grounding line.
Antarctic island coastlines (antarctica_islands_borders)
Bohlander, J. and T. Scambos. 2007. Antarctic coastlines and grounding line derived from MODIS Mosaic of Antarctica (MOA). Boulder, Colorado USA: National Snow and Ice Data Center. Digital media. Accessed 24 April 2008. Background: These outlines were hand-digitized from the Moderate-resolution Imaging Spectroradiometer (MODIS) mosaic of Antarctica (MOA) image map produced and distributed by the National Snow and Ice Data Center (NSIDC) at: http://nsidc.org/data/nsidc-0280.html. The coastline includes the ice shelves surrounding Antarctica while the grounding line excludes them. Coastlines for islands surrounding Antarctica are provided separately from the rest of Antarctica's grounding line.
country labels (country_labels)
Labels countries using the Gridded Population of the World Version 3 (GPWv3). Because Antarctica is excluded from this data set (because of its negligible population), Antarctica is labeled separately. These sources are documented and cited in their respective layers below.
country labels (excluding Antarctica) (country_labels_excluding_antarctica)
Center for International Earth Science Information Network (CIESIN), Columbia University; and Centro Internacional de Agricultura Tropical (CIAT). 2005. Gridded Population of the World Version 3 (GPWv3): National Boundaries. Palisades, NY, USA: Socioeconomic Data and Applications Center (SEDAC), Columbia University. Available at http://sedac.ciesin.columbia.edu/gpw. 19 January 2007. Background: National boundaries derived from the Gridded Population of the World (GPW) country-level land area grids at 2.5 arc-minute resolution. Permanent ice and all but large lakes have been merged with neighbouring polygons to make a layer more appropriate for cartographic visualization of the data. Does not include Antarctica.
Antarctica label (antarctica_label)
Labels Antarctica since it is excluded in the GPWv3 national boundaries data set.
Southern Ocean Fronts (southern_ocean_fronts)
Orsi, A. and U. Ryan. 2001. Locations of the various fronts in the Southern Ocean. Kingston, Tasmania, Australia: Australian Antarctic Data Centre. Digital media. Available at http://aadc-maps.aad.gov.au/aadc/metadata/metadata_redirect.cfm?md=AMD/AU/southern_ocean_fronts. 28 September 2006. Background: Hydrographic observa tions were used in this study of the Southern Ocean to improve our knowledge of large-scale aspects of the Antarctic Circumpolar Current (ACC).
Subantarctic Front (SAF) (subantarctic_front)
Orsi, A. and U. Ryan. 2001. Locations of the various fronts in the Southern Ocean. Kingston, Tasmania, Australia: Australian Antarctic Data Centre. Digital media. Available at http://aadc-maps.aad.gov.au/aadc/metadata/metadata_redirect.cfm?md=AMD/AU/southern_ocean_fronts. 28 September 2006. Background: Hydrographic observations were used in this study of the Southern Ocean to improve our knowledge of large-scale aspects of the Antarctic Circumpolar Current (ACC). The characteristic frontal structure between the meridional bounds of the ACC was examined. Previous observations have shown three deep-reaching fronts at both the Drake Passage and Greenwich Meridian. These ACC fronts appear as maxima in geostrophic transport and show distinct property characteristics at both locations. Examination of water mass properties (tracers) and volume transport estimates reveal three fronts on all synoptic sections across the ACC. The name southern ACC front is proposed here for the third, southernmost of these circumpolar current cores. Based on examination of property changes and zonal shear transports from all meridional sections, presented here, for the first time, are circumpolar paths for the Subantarctic front (SAF), Polar Front (PF) and the southern ACC front (sACCf). As portrayed by zonally-averaged theta-S relations for waters above Lower Circumpolar Deep Water (LCDW), the fronts separate distinctly different water mass regimes.
Southern Antarctic Circumpolar Current Front (sACCf) (southern_antarctic_circumpolar_current_front)
Orsi, A. and U. Ryan. 2001. Locations of the various fronts in the Southern Ocean. Kingston, Tasmania, Australia: Australian Antarctic Data Centre. Digital media. Available at http://aadc-maps.aad.gov.au/aadc/metadata/metadata_redirect.cfm?md=AMD/AU/southern_ocean_fronts. 28 September 2006. Background: Hydrographic observations were used in this study of the Southern Ocean to improve our knowledge of large-scale aspects of the Antarctic Circumpolar Current (ACC). The characteristic frontal structure between the meridional bounds of the ACC was examined. Previous observations have shown three deep-reaching fronts at both the Drake Passage and Greenwich Meridian. These ACC fronts appear as maxima in geostrophic transport and show distinct property characteristics at both locations. Examination of water mass properties (tracers) and volume transport estimates reveal three fronts on all synoptic sections across the ACC. The name southern ACC front is proposed here for the third, southernmost of these circumpolar current cores. Based on examination of property changes and zonal shear transports from all meridional sections, presented here, for the first time, are circumpolar paths for the Subantarctic front (SAF), Polar Front (PF) and the southern ACC front. As portrayed by zonally-averaged theta-S relations for waters above Lower Circumpolar Deep Water (LCDW), the fronts separate distinctly different water mass regimes.
Southern boundary of the Antarctic Circumpolar Current (ACC) (antarctic_circumpolar_current_southern_boundary)
Orsi, A. and U. Ryan. 2001. Locations of the various fronts in the Southern Ocean. Kingston, Tasmania, Australia: Australian Antarctic Data Centre. Digital media. Available at http://aadc-maps.aad.gov.au/aadc/metadata/metadata_redirect.cfm?md=AMD/AU/southern_ocean_fronts. 28 September 2006. Background: Hydrographic observations were used in this study of the Southern Ocean to improve our knowledge of large-scale aspects of the Antarctic Circumpolar Current (ACC). The characteristic frontal structure between the meridional bounds of the ACC was examined. Previous observations have shown three deep-reaching fronts at both the Drake Passage and Greenwich Meridian. These ACC fronts appear as maxima in geostrophic transport and show distinct property characteristics at both locations. Examination of water mass properties (tracers) and volume transport estimates reveal three fronts on all synoptic sections across the ACC. The name southern ACC front is proposed here for the third, southernmost of these circumpolar current cores. Based on examination of property changes and zonal shear transports from all meridional sections, presented here, for the first time, are circumpolar paths for the Subantarctic front (SAF), Polar Front (PF) and the southern ACC front (sACCf). As portrayed by zonally-averaged theta-S relations for waters above Lower Circumpolar Deep Water (LCDW), the fronts separate distinctly different water mass regimes.
Subtropical Front (STF) (subtropical_front)
Orsi, A. and U. Ryan. 2001. Locations of the various fronts in the Southern Ocean. Kingston, Tasmania, Australia: Australian Antarctic Data Centre. Digital media. Available at http://aadc-maps.aad.gov.au/aadc/metadata/metadata_redirect.cfm?md=AMD/AU/southern_ocean_fronts. 28 September 2006. Background: Hydrographic observations were used in this study of the Southern Ocean to improve our knowledge of large-scale aspects of the Antarctic Circumpolar Current (ACC). This ACC band shows relatively large geostrophic shear, when compared with the adjacent circulations in the subtropical and subpolar regimes. However, the flow is similarly sheared in the southern limbs of the subtropical gyres, particularly near the western boundary of each ocean basin, making differentiation of the ACC and subtropical regimes difficult based on shear alone. The Subtropical Front (STF) is considered the northern limit of the Subantarctic Surface Waters (SSW).
Polar Front (PF) (polar_front)
Orsi, A. and U. Ryan. 2001. Locations of the various fronts in the Southern Ocean. Kingston, Tasmania, Australia: Australian Antarctic Data Centre. Digital media. Available at http://aadc-maps.aad.gov.au/aadc/metadata/metadata_redirect.cfm?md=AMD/AU/southern_ocean_fronts. 28 September 2006. Background: Hydrographic observations were used in this study of the Southern Ocean to improve our knowledge of large-scale aspects of the Antarctic Circumpolar Current (ACC). The Antarctic Polar Front, also known as the Antarctic Convergence, is the southern front of the Antarctic Circumpolar Current that separates the Antarctic Zone in the south from the Polar Frontal Zone in the north. The Polar Front is taken by many to delineate the actual northern boundary of the Antarctic Zone. It is characterized by sea surface temperatures near 5-6 deg C and a salinity minimumum of 33.8-34.0 psu produced by high rainfall.
Southern Ocean Fronts (southern_ocean_fronts_wfs)
Orsi, A. and U. Ryan. 2001. Locations of the various fronts in the Southern Ocean. Kingston, Tasmania, Australia: Australian Antarctic Data Centre. Digital media. Available at http://aadc-maps.aad.gov.au/aadc/metadata/metadata_redirect.cfm?md=AMD/AU/southern_ocean_fronts. 28 September 2006. Background: Hydrographic observations were used in this study of the Southern Ocean to improve our knowledge of large-scale aspects of the Antarctic Circumpolar Current (ACC). Includes the following five fronts, listed in order from northernmost to southernmost: Subtropical Front (STF), Subtropical Front (STF), Polar Front (PF), Southern Antarctic Circumpolar Current Front (sACCf), and Antarctic Circumpolar Current (ACC) Southern Boundary.
x/y grid (in meters) (polar_stereo_grid_meters)
This layer displays an x/y grid in meters for the WGS 84 / Antarctic Polar Stereographic projection (EPSG:3031). This rectangular coordinate system shows the planar distance in meters from the map projection origin in the x and y dimensions. The distances are displayed in exponential notation: e.g. 2.5e+06, which is the same as 2.5x10^6 or 2,500,000 meters. The map origin is at the South Pole (-90° ) in this case, so xy values above this position on the map are positive and those below it are negative; ssimilarly, x values to the right of the South Pole are positive while those to the left are negative. The maximum extent (min x, min y, max x, max y) is approximately: -12,500,000 m; -12,500,000 m; 12,500,000 m; 12,500,000 m.
x/y grid (in pixels) (image_grid_pixels)
This layer displays an x/y grid in pixels for the displayed map image. The image width and height are displayed in number of pixels in exponential notation: e.g. 2.5e+02, which is the same as 2.5x10^2 or 250 pixels. The image origin (0,0) is in the upper-left corner.
latitude/longitude grid (graticule) (lat_long_grid)
The latitude/longitude grid (a.k.a. graticule) is provided at three resolutions depending on the current map scale: 20° (lat_long_grid_20), 10° (lat_long_grid_10), and 5° (lat_long_grid_5). Citations are provided for each of these layers below.
latitude/longitude grid (graticule) (20°) (lat_long_grid_20)
Environmental Systems Research Institute, Inc. (ESRI). 2000. Graticule. Series: ESRI Data & Maps. Redlands, CA, USA: Environmental Systems Research Institute, Inc. (ESRI). Available at http://webgis.wr.usgs.gov/globalgis/. 01 February 2001.
latitude/longitude grid (graticule) (10°) (lat_long_grid_10)
Environmental Systems Research Institute, Inc. (ESRI). 2000. Graticule. Series: ESRI Data & Maps. Redlands, CA, USA: Environmental Systems Research Institute, Inc. (ESRI). Available at http://webgis.wr.usgs.gov/globalgis/. 01 February 2001.
latitude/longitude grid (graticule) (5°) (lat_long_grid_5)
Environmental Systems Research Institute, Inc. (ESRI). 2000. Graticule. Series: ESRI Data & Maps. Redlands, CA, USA: Environmental Systems Research Institute, Inc. (ESRI). Available at http://webgis.wr.usgs.gov/globalgis/. 01 February 2001.
latitude/longitude grid (graticule) (below 5°) (lat_long_grid_below5)
This latitude/longitude graticule is generated by MapServer, the underlying map engine behind A-CAP.
Antarctic Circle (antarctic_circle)
The Antarctic Circle is the line of latitude 66°34'S (often taken as 66.5°S). Along this line, the sun does not set on the day of the summer solstice, a and does not rise on the day of the winter solstice. It is defined here as 66.56°S.
Antarctic Treaty (60°S) (antarctic_treaty)
Wikipedia contributors. 2007. Antarctic Treaty System. Wikipedia, The Free Encyclopedia. Accessed 13 June 2008. Background: The Antarctic Treaty and related agreements, collectively called the Antarctic Treaty System or ATS, regulate international relations with respect to Antarctica, Earth's only continent without a native human population. For the purposes of the treaty system, Antarctica is defined as all land and ice shelves south of 60°S latitude parallel. The treaty has now been signed by 46 countries, including the now-defunct Soviet Union, the United Kingdom, and the United States, and set aside Antarctica as a scientific preserve, established freedom of scientific investigation and banned military activity on that continent. This was the first arms control agreement established during the Cold War.
Tropic of Capricorn (tropic_of_capricorn)
The Tropic of Capricorn is the southern parallel of maximum solar declination, approximately 23°27'S latitude. It is the farthest southern latitude at wwhich the sun can appear directly overhead, which occurs on the day of the summer solstice. It is defined here as 23.44°S.
Equator (equator)
The Equator is the line of latitude 0°, which is equidistant from the poles, and which separates the Northern Hemisphere from the Southern Hemisphere.
International Date Line (international_date_line)
National Geographic Society. 1992. National Geographic Atlas of the World, Revised Sixth Edition. Washington, D.C. USA: National Geographic Society. Compiled by J. Maurer. 2007. Boulder, Colorado USA: National Snow and Ice Data Center. Digital Media. Background: The International Date Line (IDL), also known as just the Date Line, is an imaginary line on the surface of the Earth opposite the Prime Meridian which offsets the date as one travels east or west across it. Roughly along 180 degrees longitude, with diversions to pass around some territories and island groups, it corresponds to the time zone boundary separating +12 and -12 hours GMT (UT1). Crossing the IDL travelling east results in a day or 24 hours being subtracted, and crossing west results in a day being added.
Prime Meridian (prime_meridian)
The Prime Meridian is the 0 degree line of longitude, which separates the Western Hemisphere from the Eastern Hemisphere.
Antimeridian (antimeridian)
The Antimeridian is the 180 degree line of longitude, exactly opposite the Prime Meridian. It is often used as the basis for the International Date Line because it passes for the most part through the open waters of the Pacific Ocean. However, this is a simplification of the actual IDL, which curtails several countries.
Antarctic megadunes (antarctic_megadunes)
Bohlander, J. and T. Scambos. 2005. Outlines of Antarctic megadunes regions. Boulder, Colorado USA: National Snow and Ice Data Center. Background: Unlike snow dunes that are piles of drifted snow, Antarctic megadunes are long, undulating waves in the surface of the ice sheet that are 2 to 4 meters (6.5 to 13 feet) high and 2 to 5 kilometers (1 to 3 miles) apart. They are slightly rounded at their crests and are so subtle that a person on the ground cannot see the pattern. Regions of megadunes on the Antarctic ice sheet have been identified and outlined using satellite remote sensing imagery.
Antarctic megadunes (antarctic_megadunes_fill)
Bohlander, J. and T. Scambos. 2005. Outlines of Antarctic megadunes regions. Boulder, Colorado USA: National Snow and Ice Data Center. Background: Unlike snow dunes that are piles of drifted snow, Antarctic megadunes are long, undulating waves in the surface of the ice sheet that are 2 to 4 meters (6.5 to 13 feet) high and 2 to 5 kilometers (1 to 3 miles) apart. They are slightly rounded at their crests and are so subtle that a person on the ground cannot see the pattern. Regions of megadunes on the Antarctic ice sheet have been identified and outlined using satellite remote sensing imagery.
Antarctic megadunes (antarctic_megadunes_outline)
Bohlander, J. and T. Scambos. 2005. Outlines of Antarctic megadunes regions. Boulder, Colorado USA: National Snow and Ice Data Center. Background: Unlike snow dunes that are piles of drifted snow, Antarctic megadunes are long, undulating waves in the surface of the ice sheet that are 2 to 4 meters (6.5 to 13 feet) high and 2 to 5 kilometers (1 to 3 miles) apart. They are slightly rounded at their crests and are so subtle that a person on the ground cannot see the pattern. Regions of megadunes on the Antarctic ice sheet have been identified and outlined using satellite remote sensing imagery.
Antarctic megadunes (antarctic_megadunes_wfs)
Bohlander, J. and T. Scambos. 2005. Outlines of Antarctic megadunes regions. Boulder, Colorado USA: National Snow and Ice Data Center. Background: Unlike snow dunes that are piles of drifted snow, Antarctic megadunes are long, undulating waves in the surface of the ice sheet that are 2 to 4 meters (6.5 to 13 feet) high and 2 to 5 kilometers (1 to 3 miles) apart. They are slightly rounded at their crests and are so subtle that a person on the ground cannot see the pattern. Regions of megadunes on the Antarctic ice sheet have been identified and outlined using satellite remote sensing imagery.
Antarctic territorial claims (antarctic_territorial_claims)
Wikipedia contributors. 2007. List of Antarctic territorial claims. Wikipedia, The Free Encyclopedia. Available at http://en.wikipedia.org/wiki/List_of_Antarctic_territorial_claims. Accessed 24 January 2007. Background: Currently there are seven claimant nations who maintain a territorial claim on eight territories in Antarctica: Argentina (1943), Australia (1933), Chile (1940), France (1924), New Zealand (1923), Norway (1929, 1939), and the United Kingdom (1908). These countries have tended to site their scientific observation and study facilities in Antarctica within their claimed territory. It is sometimes stated that the Antarctic Treaty (1961) defers or suspends these claims. However, Article IV of the treaty, which deals with the issue of territorial claims, merely specifies that previously asserted claims are not affected by the treaty. The Soviet Union and the United States both filed reservations against the restriction on new claims, and the United States and Russia assert their right to make claims in the future if they so choose. In general, territorial claims below the 60°S parallel have only been recognised between those countries making claims in the area. However, claims are often indicated on maps of Antarctica: this does not signify de jure recognition.
Antarctic territorial claim, France (antarctic_territorial_claims_france)
Wikipedia contributors. 2007. List of Antarctic territorial claims. Wikipedia, The Free Encyclopedia. Available at http://en.wikipedia.org/wiki/List_of_Antarctic_territorial_claims. Accessed 24 January 2007. Background: France's Antarctic territorial claim dates dates back to 1924 and covers all land south of 60°S between 142°2'E and 136°11'E.
Antarctic territorial claim, Argentina (antarctic_territorial_claims_argentina)
Wikipedia contributors. 2007. List of Antarctic territorial claims. Wikipedia, The Free Encyclopedia. Available at http://en.wikipedia.org/wiki/List_of_Antarctic_territorial_claims. Accessed 24 January 2007. Background: Argentina's Antarctic territorial claim dates dates back to 1943 and covers all land south of 60°S between 25°W and 74°W.
Antarctic territorial claim, Australia (antarctic_territorial_claims_australia)
Wikipedia contributors. 2007. List of Antarctic territorial claims. Wikipedia, The Free Encyclopedia. Available at http://en.wikipedia.org/wiki/List_of_Antarctic_territorial_claims. Accessed 24 January 2007. Background: Australia's Antarctic territorial claim dates dates back to 1933 and covers all land south of 60°S between 160°E to 142°2'E and between 136°11'E to 44°38'E.
Antarctic territorial claim, Chile (antarctic_territorial_claims_chile)
Wikipedia contributors. 2007. List of Antarctic territorial claims. Wikipedia, The Free Encyclopedia. Available at http://en.wikipedia.org/wiki/List_of_Antarctic_territorial_claims. Accessed 24 January 2007. Background: Chile's Antarctic territorial claim dates dates back to 1940 and covers all land south of 60°S between 53°W and 90°W.
Antarctic territorial claim, United Kingdom (antarctic_territorial_claims_uk)
Wikipedia contributors. 2007. List of Antarctic territorial claims. Wikipedia, The Free Encyclopedia. Available at http://en.wikipedia.org/wiki/List_of_Antarctic_territorial_claims. Accessed 24 January 2007. Background: The United Kingdom's Antarctic territorial claim dates dates back to 1908 and covers all land south of 60°S between 20°W and 80°W.
Antarctic territorial claim, Norway (antarctic_territorial_claims_norway)
Wikipedia contributors. 2007. List of Antarctic territorial claims. Wikipedia, The Free Encyclopedia. Available at http://en.wikipedia.org/wiki/List_of_Antarctic_territorial_claims. Accessed 24 January 2007. Background: Norway's Antarctic territorial claim dates dates back to 1939 and covers all land between 44°38'E and 20°W. The claim does not defined its northern or southern boundaries. Norway also claims Peter I Island (68°50'S 90°35'W) (1929), which is not included in this layer.
Antarctic territorial claim, New Zealand (antarctic_territorial_claims_new_zealand)
Wikipedia contributors. 2007. List of Antarctic territorial claims. Wikipedia, The Free Encyclopedia. Available at http://en.wikipedia.org/wiki/List_of_Antarctic_territorial_claims. Accessed 24 January 2007. Background: New Zealand's Antarctic territorial claim dates dates back to 1923 and covers all land south of 60°S between 150°W and 160°E.
antarctic_territorial_claims_france (antarctic_territorial_claims_france)
antarctic_territorial_claims_france
antarctic_territorial_claims_france_fill (antarctic_territorial_claims_france_fill)
antarctic_territorial_claims_argentina (antarctic_territorial_claims_argentina)
antarctic_territorial_claims_argentina
antarctic_territorial_claims_argentina_fill (antarctic_territorial_claims_argentina_fill)
antarctic_territorial_claims_australia (antarctic_territorial_claims_australia)
antarctic_territorial_claims_australia
antarctic_territorial_claims_australia_fill (antarctic_territorial_claims_australia_fill)
antarctic_territorial_claims_chile (antarctic_territorial_claims_chile)
antarctic_territorial_claims_chile
antarctic_territorial_claims_chile_fill (antarctic_territorial_claims_chile_fill)
antarctic_territorial_claims_uk (antarctic_territorial_claims_uk)
antarctic_territorial_claims_uk
antarctic_territorial_claims_uk_fill (antarctic_territorial_claims_uk_fill)
antarctic_territorial_claims_norway (antarctic_territorial_claims_norway)
antarctic_territorial_claims_norway
Antarctic territorial claim, Norway (undefined northern limit) (antarctic_territorial_claims_norway_limit)
Wikipedia contributors. 2007. List of Antarctic territorial claims. Wikipedia, The Free Encyclopedia. Available at http://en.wikipedia.org/wiki/List_of_Antarctic_territorial_claims. Accessed 24 January 2007. Background: Norway's Antarctic territorial claim dates dates back to 1939 and covers all land between 44°38'E and 20°W. The claim does not defined its northern or southern boundaries. Norway also claims Peter I Island (68°50'S 90°35'W) (1929), which is not included in this layer. This layer provides a dashed arc at 60°S latitude to indicate the undefined northern limit of Norway's main territorial claim.
Antarctic territorial claim, Norway (label) (antarctic_territorial_claims_norway_label)
Wikipedia contributors. 2007. List of Antarctic territorial claims. Wikipedia, The Free Encyclopedia. Available at http://en.wikipedia.org/wiki/List_of_Antarctic_territorial_claims. Accessed 24 January 2007. Background: Norway's Antarctic territorial claim dates dates back to 1939 and covers all land between 44°38'E and 20°W. The claim does not defined its northern or southern boundaries. Norway also claims Peter I Island (68°50'S 90°35'W) (1929), which is not included in this layer. This layer provides a label for Norway's main territorial claim since it could not be included in the previous non-polygon layers.
antarctic_territorial_claims_norway_fill (antarctic_territorial_claims_norway_fill)
antarctic_territorial_claims_new_zealand (antarctic_territorial_claims_new_zealand)
antarctic_territorial_claims_new_zealand
antarctic_territorial_claims_new_zealand_fill (antarctic_territorial_claims_new_zealand_fill)
cities (cities)
Environmental Systems Research Institute, Inc. (ESRI). 2000. World Cities. Series: ESRI Data & Maps. Redlands, CA, USA: Environmental Systems Research Institute, Inc. (ESRI). Available at http://webgis.wr.usgs.gov/globalgis/. 01 February 2001. Background: Includes only the world's major cities.
SCAR Composite Gazetteer of Antarctica (SCAR_gazetteer)
Scientific Committee on Antarctic Research (SCAR). 1998. Composite Gazetteer of Antarctica (CGA). Rome, Italy: Programma Nazionale di Ricerche in Antartide (PNRA), in association with the Australian Antarctic Data Centre (AADC). Digital media. Available at http://data.aad.gov.au/aadc/gaz/scar/. 16 May 2008. Background: Labels for locations (a.k.a. a gazetteer) of Antarctic placenames. The Scientific Committee on Antarctic Research (SCAR) initiates, promotes and co-ordinates a wide range of scientific research programmes in Antarctica, many of which involve significant international collaboration. The SCAR Standing Committee on Antarctic Geographic Information (SC-AGI) co-ordinates the provision of a geographic reference for scientific activities in Antarctica and the dissemination of Antarctic geographic information. The SCAR Composite Gazetteer of Antarctica is an activity conducted in this framework. In 1992 the SCAR Working Group on Geodesy and Geographic Information (WG-GGI), during the XXII SCAR meeting in Bariloche, recognized the need for a composite gazetteer of Antarctica to bring some order to the complex toponymy of Antarctica. Because Antarctica does not fall under the sovereignty of any one nation this particular continent is similar, in many respects, to the oceans. In general every country has a recognized body which approves the names of geographic features in the country and also has the power to enforce their use. For Antarctica, however, there is no such single naming authority. Individual countries are responsible for their national policy on, and authorisation and use of, Antarctic names. The SCAR, through its recommendations, expresses the hope that the present effort will contribute to the adoption in Antarctica of the general principle of 'one name per feature' by all Antarctic place naming authorities.
SCAR Composite Gazetteer of Antarctica: Lands (Class #1) (SCAR_gazetteer_lands)
Scientific Committee on Antarctic Research (SCAR). 1998. Composite Gazetteer of Antarctica (CGA). Rome, Italy: Programma Nazionale di Ricerche in Antartide (PNRA), in association with the Australian Antarctic Data Centre (AADC). Digital media. Available at http://data.aad.gov.au/aadc/gaz/scar/. 16 May 2008. Background: Large continental areas, entirely or partly defined by natural boundaries. Examples: Land, Territory.
SCAR Composite Gazetteer of Antarctica: Elevated Features - a (Class #2a) (SCAR_gazetteer_elevated_features_a)
Scientific Committee on Antarctic Research (SCAR). 1998. Composite Gazetteer of Antarctica (CGA). Rome, Italy: Programma Nazionale di Ricerche in Antartide (PNRA), in association with the Australian Antarctic Data Centre (AADC). Digital media. Available at http://data.aad.gov.au/aadc/gaz/scar/. 16 May 2008. Background: Large conspicuous heights. Examples: Mount, Mountain, Volcano.
SCAR Composite Gazetteer of Antarctica: Elevated Features - b (Class #2b) (SCAR_gazetteer_elevated_features_b)
Scientific Committee on Antarctic Research (SCAR). 1998. Composite Gazetteer of Antarctica (CGA). Rome, Italy: Programma Nazionale di Ricerche in Antartide (PNRA), in association with the Australian Antarctic Data Centre (AADC). Digital media. Available at http://data.aad.gov.au/aadc/gaz/scar/. 16 May 2008. Background: Moderate to low heights. Examples: Hill, Knob, Mound, Moraine, Nunatak.
SCAR Composite Gazetteer of Antarctica: Elevated Features - c (Class #2c) (SCAR_gazetteer_elevated_features_c)
Scientific Committee on Antarctic Research (SCAR). 1998. Composite Gazetteer of Antarctica (CGA). Rome, Italy: Programma Nazionale di Ricerche in Antartide (PNRA), in association with the Australian Antarctic Data Centre (AADC). Digital media. Available at http://data.aad.gov.au/aadc/gaz/scar/. 16 May 2008. Background: Alignments and highland systems. Examples: Chain, Group, Massif, Range.
SCAR Composite Gazetteer of Antarctica: Elevated Features - d (Class #2d) (SCAR_gazetteer_elevated_features_d)
Scientific Committee on Antarctic Research (SCAR). 1998. Composite Gazetteer of Antarctica (CGA). Rome, Italy: Programma Nazionale di Ricerche in Antartide (PNRA), in association with the Australian Antarctic Data Centre (AADC). Digital media. Available at http://data.aad.gov.au/aadc/gaz/scar/. 16 May 2008. Background: High summits. Examples: Needle, Peak, Ridge, Summit, Top.
SCAR Composite Gazetteer of Antarctica: Elevated Features - e (Class #2e) (SCAR_gazetteer_elevated_features_e)
Scientific Committee on Antarctic Research (SCAR). 1998. Composite Gazetteer of Antarctica (CGA). Rome, Italy: Programma Nazionale di Ricerche in Antartide (PNRA), in association with the Australian Antarctic Data Centre (AADC). Digital media. Available at http://data.aad.gov.au/aadc/gaz/scar/. 16 May 2008. Background: Mountain passes. Examples: Col, Crossing, Gap, Pass, Saddle.
SCAR Composite Gazetteer of Antarctica: Elevated Features - f (Class #2f) (SCAR_gazetteer_elevated_features_f)
Scientific Committee on Antarctic Research (SCAR). 1998. Composite Gazetteer of Antarctica (CGA). Rome, Italy: Programma Nazionale di Ricerche in Antartide (PNRA), in association with the Australian Antarctic Data Centre (AADC). Digital media. Available at http://data.aad.gov.au/aadc/gaz/scar/. 16 May 2008. Background: Slopes and walls. Examples: Buttress, Cliff, Escarpment, Slope.
SCAR Composite Gazetteer of Antarctica: Elevated Features - g (Class #2g) (SCAR_gazetteer_elevated_features_g)
Scientific Committee on Antarctic Research (SCAR). 1998. Composite Gazetteer of Antarctica (CGA). Rome, Italy: Programma Nazionale di Ricerche in Antartide (PNRA), in association with the Australian Antarctic Data Centre (AADC). Digital media. Available at http://data.aad.gov.au/aadc/gaz/scar/. 16 May 2008. Background: Valleys. Examples: Canyon, Gorge, Gully, Valley.
SCAR Composite Gazetteer of Antarctica: Elevated Features - h (Class #2h) (SCAR_gazetteer_elevated_features_h)
Scientific Committee on Antarctic Research (SCAR). 1998. Composite Gazetteer of Antarctica (CGA). Rome, Italy: Programma Nazionale di Ricerche in Antartide (PNRA), in association with the Australian Antarctic Data Centre (AADC). Digital media. Available at http://data.aad.gov.au/aadc/gaz/scar/. 16 May 2008. Background: Plains of variable altitude. Examples: Flat, Highland, Plain, Plateau, Table.
SCAR Composite Gazetteer of Antarctica: Coves and Harbours (Class #3) (SCAR_gazetteer_coves_and_harbours)
Scientific Committee on Antarctic Research (SCAR). 1998. Composite Gazetteer of Antarctica (CGA). Rome, Italy: Programma Nazionale di Ricerche in Antartide (PNRA), in association with the Australian Antarctic Data Centre (AADC). Digital media. Available at http://data.aad.gov.au/aadc/gaz/scar/. 16 May 2008. Background: Any kind of coastal indentation, usually large and/or deep. Examples: Anchorage, Bay, Bight, Dock, Cove, Fjord, Harbour, Inlet.
SCAR Composite Gazetteer of Antarctica: Seas (Class #4) (SCAR_gazetteer_seas)
Scientific Committee on Antarctic Research (SCAR). 1998. Composite Gazetteer of Antarctica (CGA). Rome, Italy: Programma Nazionale di Ricerche in Antartide (PNRA), in association with the Australian Antarctic Data Centre (AADC). Digital media. Available at http://data.aad.gov.au/aadc/gaz/scar/. 16 May 2008. Background: Sub-division of the salt water partially covering the Earth's surface. Examples: Sea.
SCAR Composite Gazetteer of Antarctica: Islands (Class #5) (SCAR_gazetteer_islands)
Scientific Committee on Antarctic Research (SCAR). 1998. Composite Gazetteer of Antarctica (CGA). Rome, Italy: Programma Nazionale di Ricerche in Antartide (PNRA), in association with the Australian Antarctic Data Centre (AADC). Digital media. Available at http://data.aad.gov.au/aadc/gaz/scar/. 16 May 2008. Background: Islands and any kind of isolated feature (usually small) emerging from the water. Examples: Archipelago, Island, Reef, Skerry, Stack.
SCAR Composite Gazetteer of Antarctica: Sea Floor (Class #6) (SCAR_gazetteer_sea_floor)
Scientific Committee on Antarctic Research (SCAR). 1998. Composite Gazetteer of Antarctica (CGA). Rome, Italy: Programma Nazionale di Ricerche in Antartide (PNRA), in association with the Australian Antarctic Data Centre (AADC). Digital media. Available at http://data.aad.gov.au/aadc/gaz/scar/. 16 May 2008. Background: Any submarine feature. Examples: Bank, Deep, Patch, Shoal, Trench.
SCAR Composite Gazetteer of Antarctica: Sea Coasts (Class #7) (SCAR_gazetteer_sea_coasts)
Scientific Committee on Antarctic Research (SCAR). 1998. Composite Gazetteer of Antarctica (CGA). Rome, Italy: Programma Nazionale di Ricerche in Antartide (PNRA), in association with the Australian Antarctic Data Centre (AADC). Digital media. Available at http://data.aad.gov.au/aadc/gaz/scar/. 16 May 2008. Background: Any kind of shore between land and sea. Examples: Coast, Beach, Strand.
SCAR Composite Gazetteer of Antarctica: Capes and Coastal Projections (Class #8) (SCAR_gazetteer_capes_and_coastal_projections)
Scientific Committee on Antarctic Research (SCAR). 1998. Composite Gazetteer of Antarctica (CGA). Rome, Italy: Programma Nazionale di Ricerche in Antartide (PNRA), in association with the Australian Antarctic Data Centre (AADC). Digital media. Available at http://data.aad.gov.au/aadc/gaz/scar/. 16 May 2008. Background: Any kind of land feature projecting into the sea. Examples: Arm, Cape, Headland, Peninsula, Promontory, Point, Tongue.
SCAR Composite Gazetteer of Antarctica: Sea Access (Class #9) (SCAR_gazetteer_sea_access)
Scientific Committee on Antarctic Research (SCAR). 1998. Composite Gazetteer of Antarctica (CGA). Rome, Italy: Programma Nazionale di Ricerche in Antartide (PNRA), in association with the Australian Antarctic Data Centre (AADC). Digital media. Available at http://data.aad.gov.au/aadc/gaz/scar/. 16 May 2008. Background: Any kind of sea passage between two lands or between a land and an ocean. Examples: Entrance, Channel, Narrows, Passage, Sound, Strait.
SCAR Composite Gazetteer of Antarctica: Fluvial Features (Class #10) (SCAR_gazetteer_fluvial_features)
Scientific Committee on Antarctic Research (SCAR). 1998. Composite Gazetteer of Antarctica (CGA). Rome, Italy: Programma Nazionale di Ricerche in Antartide (PNRA), in association with the Australian Antarctic Data Centre (AADC). Digital media. Available at http://data.aad.gov.au/aadc/gaz/scar/. 16 May 2008. Background: Any kind of fluvial feature. Examples: River, Stream, Rapids.
SCAR Composite Gazetteer of Antarctica: Inland Water Features (Class #11) (SCAR_gazetteer_inland_water_features)
Scientific Committee on Antarctic Research (SCAR). 1998. Composite Gazetteer of Antarctica (CGA). Rome, Italy: Programma Nazionale di Ricerche in Antartide (PNRA), in association with the Australian Antarctic Data Centre (AADC). Digital media. Available at http://data.aad.gov.au/aadc/gaz/scar/. 16 May 2008. Background: Any kind of lacustrine feature. Examples: Lagoon, Lake, Pond, Pool.
SCAR Composite Gazetteer of Antarctica: Ice Features (Class #12) (SCAR_gazetteer_ice_features)
Scientific Committee on Antarctic Research (SCAR). 1998. Composite Gazetteer of Antarctica (CGA). Rome, Italy: Programma Nazionale di Ricerche in Antartide (PNRA), in association with the Australian Antarctic Data Centre (AADC). Digital media. Available at http://data.aad.gov.au/aadc/gaz/scar/. 16 May 2008. Background: Any kind of ice-made feature, except cracks. Examples: Glacier, Iceberg tongue, Ice fall, Neve.
SCAR Composite Gazetteer of Antarctica: Ice Cracks (Class #13) (SCAR_gazetteer_ice_cracks)
Scientific Committee on Antarctic Research (SCAR). 1998. Composite Gazetteer of Antarctica (CGA). Rome, Italy: Programma Nazionale di Ricerche in Antartide (PNRA), in association with the Australian Antarctic Data Centre (AADC). Digital media. Available at http://data.aad.gov.au/aadc/gaz/scar/. 16 May 2008. Background: Any kind of ice crack. Examples: Chasm, Crevasse.
SCAR Composite Gazetteer of Antarctica: Man-made Features (Class #14) (SCAR_gazetteer_man_made_features)
Scientific Committee on Antarctic Research (SCAR). 1998. Composite Gazetteer of Antarctica (CGA). Rome, Italy: Programma Nazionale di Ricerche in Antartide (PNRA), in association with the Australian Antarctic Data Centre (AADC). Digital media. Available at http://data.aad.gov.au/aadc/gaz/scar/. 16 May 2008. Background: Any kind of man-made feature, including historic monuments. Examples: Camp, Monument, Station, Base, Wharf.
SCAR Composite Gazetteer of Antarctica: Round Features (Class #15) (SCAR_gazetteer_round_features)
Scientific Committee on Antarctic Research (SCAR). 1998. Composite Gazetteer of Antarctica (CGA). Rome, Italy: Programma Nazionale di Ricerche in Antartide (PNRA), in association with the Australian Antarctic Data Centre (AADC). Digital media. Available at http://data.aad.gov.au/aadc/gaz/scar/. 16 May 2008. Background: Any feature having a circular shape. Examples: Amphitheatre, Arena, Basin, Cave, Circle, Hole.
SCAR Composite Gazetteer of Antarctica: Rookeries (Class #16) (SCAR_gazetteer_rookeries)
Scientific Committee on Antarctic Research (SCAR). 1998. Composite Gazetteer of Antarctica (CGA). Rome, Italy: Programma Nazionale di Ricerche in Antartide (PNRA), in association with the Australian Antarctic Data Centre (AADC). Digital media. Available at http://data.aad.gov.au/aadc/gaz/scar/. 16 May 2008. Background: Nesting and breeding places of a penguin colony. Examples: Rookery.
geographic features: water bodies (geographic_features_sea)
Maurer, J. compiler. 2007. Geographic features: ice, land, water. Boulder, Colorado USA: National Snow and Ice Data Center. Digital media. Accessed 20 November 2007. Background: This layer labels the locations (a.k.a. a gazetteer) of major bodies of water in the Southern Hemisphere, including oceans, seas, and Drake Passage.
geographic features: ice (geographic_features_ice)
Maurer, J. compiler. 2007. Geographic features: ice, land, water. Boulder, Colorado USA: National Snow and Ice Data Center. Digital media. Accessed 20 November 2007. Background: This layer labels the locations (a.k.a. a gazetteer) of major ice-related features in the Southern Hemisphere, including glaciers, ice caps, and ice shelves.
geographic features: land (geographic_features_land)
Maurer, J. compiler. 2007. Geographic features: ice, land, water. Boulder, Colorado USA: National Snow and Ice Data Center. Digital media. Accessed 20 November 2007. Background: This layer labels the locations (a.k.a. a gazetteer) of major land-related features in the Southern Hemisphere, including mountain ranges and Antarctic regions.
Antarctic permanent research stations (antarctic_research_stations)
Wikipedia contributors. 2007. List of research stations in Antarctica. Wikipedia, The Free Encyclopedia. Available at http://en.wikipedia.org/wiki/List_of_research_stations_in_Antarctica. Accessed 24 January 2007. Background: A number of governments maintain permanent research stations throughout Antarctica. Many of the stations are staffed around the year. A total of 30 countries (as of October 2006), all signatory to the Antarctic Treaty, operate seasonal (summer) and year-round research stations on the continent and in its surrounding oceans. The population of persons doing and supporting science on the continent and its nearby islands varies from approximately 4,000 persons during the summer season to 1,000 persons during winter.
Antarctic ice core locations (antarctic_ice_cores)
Maurer, J. compiler. 2009. Deep ice core locations. Boulder, Colorado USA: National Snow and Ice Data Center. Digital media. Accessed 03 May 2009. Background: Labels the locations of several deep ice cores from the Antarctic ice sheet, including: the European Project for Ice Coring in Antarctica (EPICA) Dome C; Siple Dome, West Antarctic Ice Sheet (WAIS) Dome A; Vostok; WAIS Divide; Byrd; Taylor Dome; Dome Fuji; Dome B; Komsomolskaya; and Talos Dome Ice Core (TALDICE).
South Poles (south_poles)
Labels the location of various types of South Poles: geographic, geomagnetic, magnetic, pole of cold, and pole of inaccessibility.
South Pole, Geographic (south_pole_geographic)
Labels the location of the South Pole (90 deg S, 0 deg), also referred to as the Geographic South Pole.
South Pole, Magnetic (south_pole_magnetic)
McClean, S. 24 January 2007. Geomagnetism Frequently Asked Questions. National Geophysical Data Center. http://www.ngdc.noaa.gov/seg/geomag/faqgeom.shtml#q4b. 24 January 2007. Background: Labels the location of the Magnetic South Pole, which in 2005 was computed to be 64.53 deg S, 137.86 deg E by the World Magnetic Model (WMM). The Eartrth's magnetic poles are the two points on the earth's surface at which magnetic meridians converge; the horizontal component of the magnetic field of the earth becomes zero at this point; also called the dip pole. The magnetic poles migrate over time.
South Pole, Geomagnetic (south_pole_geomagnetic)
McClean, S. 24 January 2007. Geomagnetism Frequently Asked Questions. National Geophysical Data Center. http://www.ngdc.noaa.gov/geomag/faqgeom.shtml. 24 January 2007. Background: Labels the location of the Geomagnetic South Pole, which in 2005 was computed to be 79.74 deg S, 108.22 deg E by the World Magnetic Model (WMM). The E Earth's geomagnetic poles are the points of intersection of the Earth's surface with the axis of a simple magnetic dipole that best approximates the Earth's actual, more complex magnetic field. If the Earth's magnetic field were a perfect dipole, then the field lines would be vertical at the geomagnetic poles and they would therefore coincide with the magnetic poles: however, the dipole approximation is in fact far from perfect, so in reality the magnetic and geomagnetic poles lie some distance apart. The geomagnetic poles migrate over time.
South Pole of Inaccessibility (south_pole_inaccessibility)
Wikipedia contributors. 20 January 2007. South Pole. Wikipedia, The Free Encyclopedia. Available at http://en.wikipedia.org/w/index.php?title=South_Pole&oldid=101993204. 24 January 2007. Background: Labels the location of the South Pole of Inaccessibility (85.83 deg S, 65.78 deg E), which is the point on the Antarctic continent farthestst from the Southern Ocean. This pole was reached on December 14, 1958 by the 3rd Soviet Antarctic Expedition, led by Yevgeny Tolstikov. At that point they established a temporary station named Polyus Nedostupnosti.
South Pole of Cold (south_pole_of_cold)
Wikipedia contributors. 23 January 2007. Pole of Cold. Wikipedia, The Free Encyclopedia. Available at http://en.wikipedia.org/w/index.php?title=Pole_of_Cold&oldid=102629381. 24 January 2007. Background: The Poles of Cold are the places in the Northern and Southern hemispheres where the lowest air temperature was recorded. In the Southern hemisphere, the Pole of Cold is in Antarctica near the Russian Antarctic station Vostok at 78.47°S, 106.8°E where a temperature of -89.2°C (-129.8°F) was recorded on Jun July 21, 1983.
South Poles (south_poles_wfs)
Labels the location of various types of South Poles: geographic, geomagnetic, magnetic, pole of cold, and pole of inaccessibility. Citations: McClean, S. 2007. Geomagnetism frequently asked questions. Boulder, Colorado USA: National Geophysical Data Center (NGDC). Available at http://www.ngdc.noaa.gov/geomag/faqgeom.shtml. Accessed 24 January 2007; Wikipedia contributors. 2007. Pole of Cold. Wikipedia, The Free Encyclopedia. Available at http://en.wikipedia.org/wiki/Pole_of_Cold. Accessed 24 January 2007; Wikipedia contributors. 2007. South Pole. Wikipedia, The Free Encyclopedia. Available at http://en.wikipedia.org/w/index.php?title=South_Pole&oldid=101993204. Accessed 24 January 2007.
map center point (center_point)
Labels the center point of the displayed map image.
NSIDC logo (National Snow and Ice Data Center) (logo_nsidc)
Provides a logo for the National Snow and Ice Data Center (NSIDC) to the lower-right-hand portion of the map. NSIDC is part of the Cooperative Institute for Research in Environmental Sciences (CIRES) at the University of Colorado at Boulder (CU). NSIDC supports research into our world's frozen realms: the snow, ice, glaciers, frozen ground, and climate interactions that make up Earth's cryosphere. NSIDC manages and distributes scientific data, creates tools for data access, supports data users, performs scientific research, and educates the public about the cryosphere. For more info, see: http://nsidc.org.
copyright (copyright)
Provides the text 'National Snow and Ice Data Center' to the lower-left-hand portion of the map to help identify NSIDC as the source of the Antarctic Cryosphere Access Portal (A-CAP) map server. Individual layers and data sets contained within A-CAP should be given proper acknowledgement, for which citations are provided in the A-CAP Web site and in the OGC GeCapabilities request.
There are currently no notifications for the service, click the feed icon to subscribe.