University of Geneva & UNEP/GRID-Geneva |
|
EnviroGRIDS Web Map Service
| Service health Now: |
|---|
- Interface
- Web Service, OGC Web Map Service 1.3.0
- Keywords
- WFS, WMS, GEOSERVER, ENVIROGRIDS
- Fees
- NONE
- Access constraints
- NONE
- Supported languages
- No INSPIRE Extended Capabilities (including service language support) given. See INSPIRE Technical Guidance - View Services for more information.
- Data provider
-
University of Geneva & UNEP/GRID-Geneva (unverified)
Contact information:
Gregory Giuliani
University of Geneva & UNEP/GRID-Geneva
7 route de Drize, 1227 Carouge, USA
Email:
Phone: +41 22 917 84 17
- Service metadata
- No INSPIRE Extended Capabilities (including service metadata) given. See INSPIRE Technical Guidance - View Services for more information.
Ads by Google
EnviroGRIDS WMS
Available map layers (57)
ALONE_PopDensity (eg_scenarios:ALONE_PopDensity)
COOL_PopDensity (eg_scenarios:COOL_PopDensity)
COOP_PopDensity (eg_scenarios:COOP_PopDensity)
HOT_PopDensity (eg_scenarios:HOT_PopDensity)
CRU Precipitation B2 scenario: Daily Precipitation 01/01/2071 (eg_scenarios:Precipitation_CRU_HB1__2071_etrs89)
CRU Precipitation B2 scenario: Daily Precipitation 01/01/2086 (eg_scenarios:Precipitation_CRU_HB1__2086_etrs89)
CRU Precipitation B2 scenario: Daily Precipitation 01/01/2100 (eg_scenarios:Precipitation_CRU_HB1__2100_etrs89)
CRU Precipitation Observations: Daily Precipitation 01/01/1976 (eg_scenarios:Precipitation_CRU_Obs__1976_etrs89)
CRU Precipitation Observations: Daily Precipitation 01/01/1991 (eg_scenarios:Precipitation_CRU_Obs__1991_etrs89)
CRU Precipitation Observations: Daily Precipitation 01/01/2005 (eg_scenarios:Precipitation_CRU_Obs__2005_etrs89)
CRU Temperature Max A2 scenario: Daily Max Temperature 01/01/2071 (eg_scenarios:Temperature_max_CRU_HS1__2071_etrs89)
CRU Temperature Max A2 scenario: Daily Max Temperature 01/01/2100 (eg_scenarios:Temperature_max_CRU_HS1__2100_etrs89)
CRU Temperature Max Observations: Daily Max Temperature 01/01/1976 (eg_scenarios:Temperature_max_CRU_Obs__1976_etrs89)
CRU Temperature Max Observations: Daily Max Temperature 01/01/2005 (eg_scenarios:Temperature_max_CRU_Obs__2005_etrs89)
STN Temperature Min B2 scenario: Daily Min Temperature 01/01/2071 (eg_scenarios:Temperature_min_STN_HB1__2071_etrs89)
STN Temperature Min B2 scenario: Daily Min Temperature 01/01/2100 (eg_scenarios:Temperature_min_STN_HB1__2100_etrs89)
STN Temperature Min Observations: Daily Min Temperature 01/01/1976 (eg_scenarios:Temperature_min_STN_Obs__1976_etrs89)
STN Temperature Min Observations: Daily Min Temperature 01/01/2005 (eg_scenarios:Temperature_min_STN_Obs__2005_etrs89)
Land use scenario Black Sea catchment: ALONE 2010 (eg_scenarios:alone2010)
The data consist in a set of GIS maps representing the LU for the total area of the black sea basin for the years 2025 and 2050 per each scenario (HOT, ALONE, COOP, COOL). More information about scenario storyline description is reachable in previous delivery D3.7: http://www.envirogrids.net/index.php?option=com_content &view=article&id=23&Itemid=40 Each map of LU is subdivided into 10 classes where crops/natural vegetation, shrubland, barren or sparsely vegetated, forest, grassland, croplands and urban and built-up areas, changing along the years and water, snow and ice and permanent wetlands remain fixed. http://129.194.231.213:8080/geonetwork/srv/en/main.home
Land use scenario Black Sea catchment: ALONE 2015 (eg_scenarios:alone2015)
The data consist in a set of GIS maps representing the LU for the total area of the black sea basin for the years 2025 and 2050 per each scenario (HOT, ALONE, COOP, COOL). More information about scenario storyline description is reachable in previous delivery D3.7: http://www.envirogrids.net/index.php?option=com_content &view=article&id=23&Itemid=40 Each map of LU is subdivided into 10 classes where crops/natural vegetation, shrubland, barren or sparsely vegetated, forest, grassland, croplands and urban and built-up areas, changing along the years and water, snow and ice and permanent wetlands remain fixed. http://129.194.231.213:8080/geonetwork/srv/en/main.home
Land use scenario Black Sea catchment: ALONE 2020 (eg_scenarios:alone2020)
The data consist in a set of GIS maps representing the LU for the total area of the black sea basin for the years 2025 and 2050 per each scenario (HOT, ALONE, COOP, COOL). More information about scenario storyline description is reachable in previous delivery D3.7: http://www.envirogrids.net/index.php?option=com_content &view=article&id=23&Itemid=40 Each map of LU is subdivided into 10 classes where crops/natural vegetation, shrubland, barren or sparsely vegetated, forest, grassland, croplands and urban and built-up areas, changing along the years and water, snow and ice and permanent wetlands remain fixed. http://129.194.231.213:8080/geonetwork/srv/en/main.home
Land use scenario Black Sea catchment: ALONE 2025 (eg_scenarios:alone2025)
The data consist in a set of GIS maps representing the LU for the total area of the black sea basin for the years 2025 and 2050 per each scenario (HOT, ALONE, COOP, COOL). More information about scenario storyline description is reachable in previous delivery D3.7: http://www.envirogrids.net/index.php?option=com_content &view=article&id=23&Itemid=40 Each map of LU is subdivided into 10 classes where crops/natural vegetation, shrubland, barren or sparsely vegetated, forest, grassland, croplands and urban and built-up areas, changing along the years and water, snow and ice and permanent wetlands remain fixed. http://129.194.231.213:8080/geonetwork/srv/en/main.home
Land use scenario Black Sea catchment: ALONE 2030 (eg_scenarios:alone2030)
The data consist in a set of GIS maps representing the LU for the total area of the black sea basin for the years 2025 and 2050 per each scenario (HOT, ALONE, COOP, COOL). More information about scenario storyline description is reachable in previous delivery D3.7: http://www.envirogrids.net/index.php?option=com_content &view=article&id=23&Itemid=40 Each map of LU is subdivided into 10 classes where crops/natural vegetation, shrubland, barren or sparsely vegetated, forest, grassland, croplands and urban and built-up areas, changing along the years and water, snow and ice and permanent wetlands remain fixed. http://129.194.231.213:8080/geonetwork/srv/en/main.home
Land use scenario Black Sea catchment: ALONE 2035 (eg_scenarios:alone2035)
The data consist in a set of GIS maps representing the LU for the total area of the black sea basin for the years 2025 and 2050 per each scenario (HOT, ALONE, COOP, COOL). More information about scenario storyline description is reachable in previous delivery D3.7: http://www.envirogrids.net/index.php?option=com_content &view=article&id=23&Itemid=40 Each map of LU is subdivided into 10 classes where crops/natural vegetation, shrubland, barren or sparsely vegetated, forest, grassland, croplands and urban and built-up areas, changing along the years and water, snow and ice and permanent wetlands remain fixed. http://129.194.231.213:8080/geonetwork/srv/en/main.home
Land use scenario Black Sea catchment: ALONE 2040 (eg_scenarios:alone2040)
The data consist in a set of GIS maps representing the LU for the total area of the black sea basin for the years 2025 and 2050 per each scenario (HOT, ALONE, COOP, COOL). More information about scenario storyline description is reachable in previous delivery D3.7: http://www.envirogrids.net/index.php?option=com_content &view=article&id=23&Itemid=40 Each map of LU is subdivided into 10 classes where crops/natural vegetation, shrubland, barren or sparsely vegetated, forest, grassland, croplands and urban and built-up areas, changing along the years and water, snow and ice and permanent wetlands remain fixed. http://129.194.231.213:8080/geonetwork/srv/en/main.home
Land use scenario Black Sea catchment: ALONE 2045 (eg_scenarios:alone2045)
The data consist in a set of GIS maps representing the LU for the total area of the black sea basin for the years 2025 and 2050 per each scenario (HOT, ALONE, COOP, COOL). More information about scenario storyline description is reachable in previous delivery D3.7: http://www.envirogrids.net/index.php?option=com_content &view=article&id=23&Itemid=40 Each map of LU is subdivided into 10 classes where crops/natural vegetation, shrubland, barren or sparsely vegetated, forest, grassland, croplands and urban and built-up areas, changing along the years and water, snow and ice and permanent wetlands remain fixed. http://129.194.231.213:8080/geonetwork/srv/en/main.home
Land use scenario Black Sea catchment: ALONE 2050 (eg_scenarios:alone2050)
The data consist in a set of GIS maps representing the LU for the total area of the black sea basin for the years 2025 and 2050 per each scenario (HOT, ALONE, COOP, COOL). More information about scenario storyline description is reachable in previous delivery D3.7: http://www.envirogrids.net/index.php?option=com_content &view=article&id=23&Itemid=40 Each map of LU is subdivided into 10 classes where crops/natural vegetation, shrubland, barren or sparsely vegetated, forest, grassland, croplands and urban and built-up areas, changing along the years and water, snow and ice and permanent wetlands remain fixed. http://129.194.231.213:8080/geonetwork/srv/en/main.home
Land use scenario Black Sea catchment: COOL 2010 (eg_scenarios:cool2010)
The data consist in a set of GIS maps representing the LU for the total area of the black sea basin for the years 2025 and 2050 per each scenario (HOT, ALONE, COOP, COOL). More information about scenario storyline description is reachable in previous delivery D3.7: http://www.envirogrids.net/index.php?option=com_content &view=article&id=23&Itemid=40 Each map of LU is subdivided into 10 classes where crops/natural vegetation, shrubland, barren or sparsely vegetated, forest, grassland, croplands and urban and built-up areas, changing along the years and water, snow and ice and permanent wetlands remain fixed. http://129.194.231.213:8080/geonetwork/srv/en/main.home
Land use scenario Black Sea catchment: COOL 2015 (eg_scenarios:cool2015)
The data consist in a set of GIS maps representing the LU for the total area of the black sea basin for the years 2025 and 2050 per each scenario (HOT, ALONE, COOP, COOL). More information about scenario storyline description is reachable in previous delivery D3.7: http://www.envirogrids.net/index.php?option=com_content &view=article&id=23&Itemid=40 Each map of LU is subdivided into 10 classes where crops/natural vegetation, shrubland, barren or sparsely vegetated, forest, grassland, croplands and urban and built-up areas, changing along the years and water, snow and ice and permanent wetlands remain fixed. http://129.194.231.213:8080/geonetwork/srv/en/main.home
Land use scenario Black Sea catchment: COOL 2020 (eg_scenarios:cool2020)
The data consist in a set of GIS maps representing the LU for the total area of the black sea basin for the years 2025 and 2050 per each scenario (HOT, ALONE, COOP, COOL). More information about scenario storyline description is reachable in previous delivery D3.7: http://www.envirogrids.net/index.php?option=com_content &view=article&id=23&Itemid=40 Each map of LU is subdivided into 10 classes where crops/natural vegetation, shrubland, barren or sparsely vegetated, forest, grassland, croplands and urban and built-up areas, changing along the years and water, snow and ice and permanent wetlands remain fixed. http://129.194.231.213:8080/geonetwork/srv/en/main.home
Land use scenario Black Sea catchment: COOL 2025 (eg_scenarios:cool2025)
The data consist in a set of GIS maps representing the LU for the total area of the black sea basin for the years 2025 and 2050 per each scenario (HOT, ALONE, COOP, COOL). More information about scenario storyline description is reachable in previous delivery D3.7: http://www.envirogrids.net/index.php?option=com_content &view=article&id=23&Itemid=40 Each map of LU is subdivided into 10 classes where crops/natural vegetation, shrubland, barren or sparsely vegetated, forest, grassland, croplands and urban and built-up areas, changing along the years and water, snow and ice and permanent wetlands remain fixed. http://129.194.231.213:8080/geonetwork/srv/en/main.home
Land use scenario Black Sea catchment: COOL 2030 (eg_scenarios:cool2030)
The data consist in a set of GIS maps representing the LU for the total area of the black sea basin for the years 2025 and 2050 per each scenario (HOT, ALONE, COOP, COOL). More information about scenario storyline description is reachable in previous delivery D3.7: http://www.envirogrids.net/index.php?option=com_content &view=article&id=23&Itemid=40 Each map of LU is subdivided into 10 classes where crops/natural vegetation, shrubland, barren or sparsely vegetated, forest, grassland, croplands and urban and built-up areas, changing along the years and water, snow and ice and permanent wetlands remain fixed. http://129.194.231.213:8080/geonetwork/srv/en/main.home
Land use scenario Black Sea catchment: COOL 2035 (eg_scenarios:cool2035)
The data consist in a set of GIS maps representing the LU for the total area of the black sea basin for the years 2025 and 2050 per each scenario (HOT, ALONE, COOP, COOL). More information about scenario storyline description is reachable in previous delivery D3.7: http://www.envirogrids.net/index.php?option=com_content &view=article&id=23&Itemid=40 Each map of LU is subdivided into 10 classes where crops/natural vegetation, shrubland, barren or sparsely vegetated, forest, grassland, croplands and urban and built-up areas, changing along the years and water, snow and ice and permanent wetlands remain fixed. http://129.194.231.213:8080/geonetwork/srv/en/main.home
Land use scenario Black Sea catchment: COOL 2045 (eg_scenarios:cool2045)
The data consist in a set of GIS maps representing the LU for the total area of the black sea basin for the years 2025 and 2050 per each scenario (HOT, ALONE, COOP, COOL). More information about scenario storyline description is reachable in previous delivery D3.7: http://www.envirogrids.net/index.php?option=com_content &view=article&id=23&Itemid=40 Each map of LU is subdivided into 10 classes where crops/natural vegetation, shrubland, barren or sparsely vegetated, forest, grassland, croplands and urban and built-up areas, changing along the years and water, snow and ice and permanent wetlands remain fixed. http://129.194.231.213:8080/geonetwork/srv/en/main.home
Land use scenario Black Sea catchment: COOL 2050 (eg_scenarios:cool2050)
The data consist in a set of GIS maps representing the LU for the total area of the black sea basin for the years 2025 and 2050 per each scenario (HOT, ALONE, COOP, COOL). More information about scenario storyline description is reachable in previous delivery D3.7: http://www.envirogrids.net/index.php?option=com_content &view=article&id=23&Itemid=40 Each map of LU is subdivided into 10 classes where crops/natural vegetation, shrubland, barren or sparsely vegetated, forest, grassland, croplands and urban and built-up areas, changing along the years and water, snow and ice and permanent wetlands remain fixed. http://129.194.231.213:8080/geonetwork/srv/en/main.home
Land use scenario Black Sea catchment: COOP 2010 (eg_scenarios:coop2010)
The data consist in a set of GIS maps representing the LU for the total area of the black sea basin for the years 2025 and 2050 per each scenario (HOT, ALONE, COOP, COOL). More information about scenario storyline description is reachable in previous delivery D3.7: http://www.envirogrids.net/index.php?option=com_content &view=article&id=23&Itemid=40 Each map of LU is subdivided into 10 classes where crops/natural vegetation, shrubland, barren or sparsely vegetated, forest, grassland, croplands and urban and built-up areas, changing along the years and water, snow and ice and permanent wetlands remain fixed. http://129.194.231.213:8080/geonetwork/srv/en/main.home
Land use scenario Black Sea catchment: COOP 2015 (eg_scenarios:coop2015)
The data consist in a set of GIS maps representing the LU for the total area of the black sea basin for the years 2025 and 2050 per each scenario (HOT, ALONE, COOP, COOL). More information about scenario storyline description is reachable in previous delivery D3.7: http://www.envirogrids.net/index.php?option=com_content &view=article&id=23&Itemid=40 Each map of LU is subdivided into 10 classes where crops/natural vegetation, shrubland, barren or sparsely vegetated, forest, grassland, croplands and urban and built-up areas, changing along the years and water, snow and ice and permanent wetlands remain fixed. http://129.194.231.213:8080/geonetwork/srv/en/main.home
Land use scenario Black Sea catchment: COOP 2020 (eg_scenarios:coop2020)
The data consist in a set of GIS maps representing the LU for the total area of the black sea basin for the years 2025 and 2050 per each scenario (HOT, ALONE, COOP, COOL). More information about scenario storyline description is reachable in previous delivery D3.7: http://www.envirogrids.net/index.php?option=com_content &view=article&id=23&Itemid=40 Each map of LU is subdivided into 10 classes where crops/natural vegetation, shrubland, barren or sparsely vegetated, forest, grassland, croplands and urban and built-up areas, changing along the years and water, snow and ice and permanent wetlands remain fixed. http://129.194.231.213:8080/geonetwork/srv/en/main.home
Land use scenario Black Sea catchment: COOP 2025 (eg_scenarios:coop2025)
The data consist in a set of GIS maps representing the LU for the total area of the black sea basin for the years 2025 and 2050 per each scenario (HOT, ALONE, COOP, COOL). More information about scenario storyline description is reachable in previous delivery D3.7: http://www.envirogrids.net/index.php?option=com_content &view=article&id=23&Itemid=40 Each map of LU is subdivided into 10 classes where crops/natural vegetation, shrubland, barren or sparsely vegetated, forest, grassland, croplands and urban and built-up areas, changing along the years and water, snow and ice and permanent wetlands remain fixed. http://129.194.231.213:8080/geonetwork/srv/en/main.home
Land use scenario Black Sea catchment: COOP 2030 (eg_scenarios:coop2030)
The data consist in a set of GIS maps representing the LU for the total area of the black sea basin for the years 2025 and 2050 per each scenario (HOT, ALONE, COOP, COOL). More information about scenario storyline description is reachable in previous delivery D3.7: http://www.envirogrids.net/index.php?option=com_content &view=article&id=23&Itemid=40 Each map of LU is subdivided into 10 classes where crops/natural vegetation, shrubland, barren or sparsely vegetated, forest, grassland, croplands and urban and built-up areas, changing along the years and water, snow and ice and permanent wetlands remain fixed. http://129.194.231.213:8080/geonetwork/srv/en/main.home
Land use scenario Black Sea catchment: COOP 2035 (eg_scenarios:coop2035)
The data consist in a set of GIS maps representing the LU for the total area of the black sea basin for the years 2025 and 2050 per each scenario (HOT, ALONE, COOP, COOL). More information about scenario storyline description is reachable in previous delivery D3.7: http://www.envirogrids.net/index.php?option=com_content &view=article&id=23&Itemid=40 Each map of LU is subdivided into 10 classes where crops/natural vegetation, shrubland, barren or sparsely vegetated, forest, grassland, croplands and urban and built-up areas, changing along the years and water, snow and ice and permanent wetlands remain fixed. http://129.194.231.213:8080/geonetwork/srv/en/main.home
Land use scenario Black Sea catchment: COOP 2040 (eg_scenarios:coop2040)
The data consist in a set of GIS maps representing the LU for the total area of the black sea basin for the years 2025 and 2050 per each scenario (HOT, ALONE, COOP, COOL). More information about scenario storyline description is reachable in previous delivery D3.7: http://www.envirogrids.net/index.php?option=com_content &view=article&id=23&Itemid=40 Each map of LU is subdivided into 10 classes where crops/natural vegetation, shrubland, barren or sparsely vegetated, forest, grassland, croplands and urban and built-up areas, changing along the years and water, snow and ice and permanent wetlands remain fixed. http://129.194.231.213:8080/geonetwork/srv/en/main.home
Land use scenario Black Sea catchment: COOP 2045 (eg_scenarios:coop2045)
The data consist in a set of GIS maps representing the LU for the total area of the black sea basin for the years 2025 and 2050 per each scenario (HOT, ALONE, COOP, COOL). More information about scenario storyline description is reachable in previous delivery D3.7: http://www.envirogrids.net/index.php?option=com_content &view=article&id=23&Itemid=40 Each map of LU is subdivided into 10 classes where crops/natural vegetation, shrubland, barren or sparsely vegetated, forest, grassland, croplands and urban and built-up areas, changing along the years and water, snow and ice and permanent wetlands remain fixed. http://129.194.231.213:8080/geonetwork/srv/en/main.home
Land use scenario Black Sea catchment: COOP 2050 (eg_scenarios:coop2050)
The data consist in a set of GIS maps representing the LU for the total area of the black sea basin for the years 2025 and 2050 per each scenario (HOT, ALONE, COOP, COOL). More information about scenario storyline description is reachable in previous delivery D3.7: http://www.envirogrids.net/index.php?option=com_content &view=article&id=23&Itemid=40 Each map of LU is subdivided into 10 classes where crops/natural vegetation, shrubland, barren or sparsely vegetated, forest, grassland, croplands and urban and built-up areas, changing along the years and water, snow and ice and permanent wetlands remain fixed. http://129.194.231.213:8080/geonetwork/srv/en/main.home
Land use scenario Black Sea catchment: HOT 2010 (eg_scenarios:hot2010)
The data consist in a set of GIS maps representing the LU for the total area of the black sea basin for the years 2025 and 2050 per each scenario (HOT, ALONE, COOP, COOL). More information about scenario storyline description is reachable in previous delivery D3.7: http://www.envirogrids.net/index.php?option=com_content &view=article&id=23&Itemid=40 Each map of LU is subdivided into 10 classes where crops/natural vegetation, shrubland, barren or sparsely vegetated, forest, grassland, croplands and urban and built-up areas, changing along the years and water, snow and ice and permanent wetlands remain fixed.
Land use scenario Black Sea catchment: HOT 2015 (eg_scenarios:hot2015)
The data consist in a set of GIS maps representing the LU for the total area of the black sea basin for the years 2025 and 2050 per each scenario (HOT, ALONE, COOP, COOL). More information about scenario storyline description is reachable in previous delivery D3.7: http://www.envirogrids.net/index.php?option=com_content &view=article&id=23&Itemid=40 Each map of LU is subdivided into 10 classes where crops/natural vegetation, shrubland, barren or sparsely vegetated, forest, grassland, croplands and urban and built-up areas, changing along the years and water, snow and ice and permanent wetlands remain fixed. http://129.194.231.213:8080/geonetwork/srv/en/main.home
Land use scenario Black Sea catchment: HOT 2020 (eg_scenarios:hot2020)
The data consist in a set of GIS maps representing the LU for the total area of the black sea basin for the years 2025 and 2050 per each scenario (HOT, ALONE, COOP, COOL). More information about scenario storyline description is reachable in previous delivery D3.7: http://www.envirogrids.net/index.php?option=com_content &view=article&id=23&Itemid=40 Each map of LU is subdivided into 10 classes where crops/natural vegetation, shrubland, barren or sparsely vegetated, forest, grassland, croplands and urban and built-up areas, changing along the years and water, snow and ice and permanent wetlands remain fixed. http://129.194.231.213:8080/geonetwork/srv/en/main.home
Land use scenario Black Sea catchment: HOT 2025 (eg_scenarios:hot2025)
The data consist in a set of GIS maps representing the LU for the total area of the black sea basin for the years 2025 and 2050 per each scenario (HOT, ALONE, COOP, COOL). More information about scenario storyline description is reachable in previous delivery D3.7: http://www.envirogrids.net/index.php?option=com_content &view=article&id=23&Itemid=40 Each map of LU is subdivided into 10 classes where crops/natural vegetation, shrubland, barren or sparsely vegetated, forest, grassland, croplands and urban and built-up areas, changing along the years and water, snow and ice and permanent wetlands remain fixed. http://129.194.231.213:8080/geonetwork/srv/en/main.home
Land use scenario Black Sea catchment: HOT 2030 (eg_scenarios:hot2030)
The data consist in a set of GIS maps representing the LU for the total area of the black sea basin for the years 2025 and 2050 per each scenario (HOT, ALONE, COOP, COOL). More information about scenario storyline description is reachable in previous delivery D3.7: http://www.envirogrids.net/index.php?option=com_content &view=article&id=23&Itemid=40 Each map of LU is subdivided into 10 classes where crops/natural vegetation, shrubland, barren or sparsely vegetated, forest, grassland, croplands and urban and built-up areas, changing along the years and water, snow and ice and permanent wetlands remain fixed. http://129.194.231.213:8080/geonetwork/srv/en/main.home
Land use scenario Black Sea catchment: HOT 2035 (eg_scenarios:hot2035)
The data consist in a set of GIS maps representing the LU for the total area of the black sea basin for the years 2025 and 2050 per each scenario (HOT, ALONE, COOP, COOL). More information about scenario storyline description is reachable in previous delivery D3.7: http://www.envirogrids.net/index.php?option=com_content &view=article&id=23&Itemid=40 Each map of LU is subdivided into 10 classes where crops/natural vegetation, shrubland, barren or sparsely vegetated, forest, grassland, croplands and urban and built-up areas, changing along the years and water, snow and ice and permanent wetlands remain fixed. http://129.194.231.213:8080/geonetwork/srv/en/main.home
Land use scenario Black Sea catchment: HOT 2040 (eg_scenarios:hot2040)
The data consist in a set of GIS maps representing the LU for the total area of the black sea basin for the years 2025 and 2050 per each scenario (HOT, ALONE, COOP, COOL). More information about scenario storyline description is reachable in previous delivery D3.7: http://www.envirogrids.net/index.php?option=com_content &view=article&id=23&Itemid=40 Each map of LU is subdivided into 10 classes where crops/natural vegetation, shrubland, barren or sparsely vegetated, forest, grassland, croplands and urban and built-up areas, changing along the years and water, snow and ice and permanent wetlands remain fixed. http://129.194.231.213:8080/geonetwork/srv/en/main.home
Land use scenario Black Sea catchment: HOT 2045 (eg_scenarios:hot2045)
The data consist in a set of GIS maps representing the LU for the total area of the black sea basin for the years 2025 and 2050 per each scenario (HOT, ALONE, COOP, COOL). More information about scenario storyline description is reachable in previous delivery D3.7: http://www.envirogrids.net/index.php?option=com_content &view=article&id=23&Itemid=40 Each map of LU is subdivided into 10 classes where crops/natural vegetation, shrubland, barren or sparsely vegetated, forest, grassland, croplands and urban and built-up areas, changing along the years and water, snow and ice and permanent wetlands remain fixed. http://129.194.231.213:8080/geonetwork/srv/en/main.home
Land use scenario Black Sea catchment: HOT 2050 (eg_scenarios:hot2050)
The data consist in a set of GIS maps representing the LU for the total area of the black sea basin for the years 2025 and 2050 per each scenario (HOT, ALONE, COOP, COOL). More information about scenario storyline description is reachable in previous delivery D3.7: http://www.envirogrids.net/index.php?option=com_content &view=article&id=23&Itemid=40 Each map of LU is subdivided into 10 classes where crops/natural vegetation, shrubland, barren or sparsely vegetated, forest, grassland, croplands and urban and built-up areas, changing along the years and water, snow and ice and permanent wetlands remain fixed. http://129.194.231.213:8080/geonetwork/srv/en/main.home
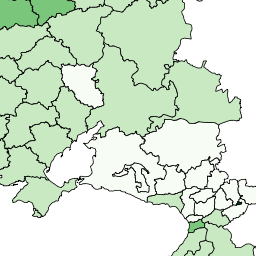
Total population at subnational level (NUT2) 2001-2010 (eg_scenarios:pop_tot_01_10)
According with the enviroGRIDS scenarios, we analyze the UN projection variants for population, and we propose a methodology for the downscaling from national to regional level (NUTS2). Results include urban and total population trends over the period 2010-2050 for the 214 enviroGRIDS regions, consistent with BS HOT, BS ALONE, BS COOP and BS COOL scenarios.
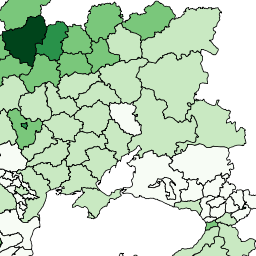
Total population projections, subnational level (NUT2) 2011-2050 UN medium variant (eg_scenarios:pop_tot_11_50_M)
According with the enviroGRIDS scenarios, we analyze the UN projection variants for population, and we propose a methodology for the downscaling from national to regional level (NUTS2). Results include urban and total population trends over the period 2010-2050 for the 214 enviroGRIDS regions, consistent with BS HOT, BS ALONE, BS COOP and BS COOL scenarios.
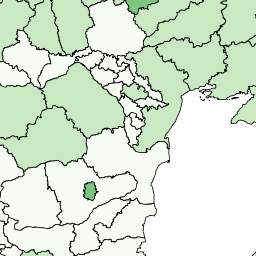
Urban population at subnational level (NUT2) 2001-2010 (eg_scenarios:pop_urb_01_10)
According with the enviroGRIDS scenarios, we analyze the UN projection variants for population, and we propose a methodology for the downscaling from national to regional level (NUTS2). Results include urban and total population trends over the period 2010-2050 for the 214 enviroGRIDS regions, consistent with BS HOT, BS ALONE, BS COOP and BS COOL scenarios.
Urban population projections, subnational level (NUT2) 2010-2050 UN medium variant (eg_scenarios:pop_urb_11_50_M)
According with the enviroGRIDS scenarios, we analyze the UN projection variants for population, and we propose a methodology for the downscaling from national to regional level (NUTS2). Results include urban and total population trends over the period 2010-2050 for the 214 enviroGRIDS regions, consistent with BS HOT, BS ALONE, BS COOP and BS COOL scenarios.
There are currently no notifications for the service, click the feed icon to subscribe.