[unknown data provider] |
|
| Service health Now: |
|---|
- Interface
- Web Service, OGC Web Map Service 1.3.0
- Keywords
- Fees
- unknown
- Access constraints
- unknown
- Supported languages
- No INSPIRE Extended Capabilities (including service language support) given. See INSPIRE Technical Guidance - View Services for more information.
- Data provider
-
unknown (unverified)
Contact information:
- Service metadata
- No INSPIRE Extended Capabilities (including service metadata) given. See INSPIRE Technical Guidance - View Services for more information.
Ads by Google
WMS
Available map layers (23)
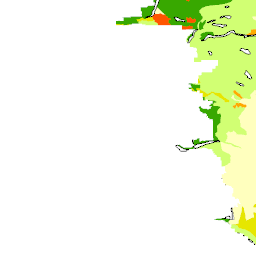
Wind Erosion Risk (0)
This map displays the risk of soil degradation by wind in the agricultural region of Alberta. Wind erosion is a concern because it reduces soil quality by removing soil nutrients, smaller soil particles and organic matter. Wind erosion can reduce air quality during extreme erosion events and also reduce water quality if eroded particles drift into streams and lakes.
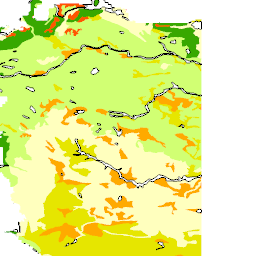
Water Erosion Risk (1)
This map displays the risk of soil degradation by water in the agricultural region of Alberta. Water erosion is a concern because it reduces soil quality by removing soil particles and nutrients, and reduces water quality if these particles are carried into nearby water bodies.
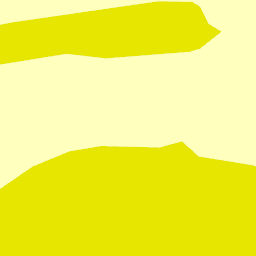
Surface Water Quality Risk (2)
This map displays an assessment of surface water quality risk for the agricultural area of Alberta. Agricultural activities that may have an impact on surface water quality, including livestock, crop production and agrochemical use, were identified and used to produce this map. The classes shown on the map were ranked from 0 (lowest risk) to 1 (highest risk).
Solonetzic Soils (3)
This map displays the distribution of Solonetzic soils in the agricultural region of Alberta. Solonetzic soils have developed on saline parent material that is high in sodium and have a characteristic hardpan layer that has formed in the subsoil. This hardpan is very hard when dry and has low permeability when wet. This results in restricted root and water penetration that may limit the productivity of these soils. Solonetzic soils occur in association with Chernozemic soils and, to a lesser extent, with Luvisolic soils.
Soil Texture (4)
This map illustrates the distribution of soil parent material textures in the agricultural region of Alberta. Soil texture is defined by the relative proportions of the sand, silt and clay particles present. Soil textures are identified by classes using the Soil Texture Triangle illustrated below. The Soil Texture Triangle identifies the textural class of a soil at the intersection of the percent sand (x-axis) and the percent clay (y-axis). The percent silt of the soil is the remainder to add up to 100 percent. For presentation on this map, the texture classes of soil parent materials identified with each Agricultural Region of Alberta Soil Inventory Database (AGRASID) soil landscape polygon were combined into four more general groups - fine, medium, moderately coarse and very coarse. These are represented on the map by solid colors when the areal extent of the texture group occupies more than or equal to 60 percent of the soil area. Textural groupings with patterned symbols are complex areas where texture groups occupy more than or equal to 30 percent, but less than 60 percent of the area.
Soil Groups (5)
This map displays the distribution of the main soil types found within the province. The distribution pattern of soils in Alberta is strongly linked to climate and parent materials. Climate affects the location of different soil groups. The driest area in southeastern Alberta is represented by the presence of Brown Chernozems. As one proceeds north and west, the soils and associated vegetation reflect the increase in available moisture.
Soil Erosion Risk (6)
This map displays an assessment of soil erosion risk for the agricultural area of Alberta. Loss of protective residue cover through cultivation will increase the potential risk of soil erosion. The vulnerability of the soil to erosion combined with the intensity of cultivation determines the degree to which the soil may be at risk. The classes shown on the map were ranked from 0 (lowest risk) to 1 (highest risk).
Saline Soils (7)
This map displays the occurrence of saline soils in the agricultural region of Alberta. A saline soil is a non-alkali (pH less than 8.5 and exchangeable-sodium less than 15%) soil containing soluble salts in great enough quantities that they interfere with the growth of most crop plants. For this map, saline soils were defined as having a soil horizon with an electrical conductivity (EC) of greater than or equal to 4.0 mS/cm within 30 cm of the surface. This is the level of salinity at which crop growth is significantly reduced.
Organic Soils (8)
This map displays the distribution of organic soils in the agricultural region of Alberta. Organic soils consist of layers of material with greater than 30 percent organic matter and a total thickness of greater than 40 cm. Organic soils are generally saturated with water for most of the year unless drained. Saturation inhibits decomposition and encourages continued accumulation of organic material. Drainage of these soils can result in a rapid increase in decomposition and a reduction in the thickness of the organic material.
Organic Matter Content of Cultivated Soils (9)
This map displays the percentage of organic matter in the surface layer of cultivated soils in the agricultural region of Alberta. Soil organic matter (SOM) is derived primarily from the decomposition of plant biomass. SOM improves both the physical and chemical properties of soil and has beneficial effects on agricultural soil quality. SOM is reported on the map as a percentage using the following classes: less than 2 (very low), 2 to 4 (low), 4 to 6 (medium), 6 to 8 (high) and greater than 8 (very high).
Number of Species at Risk (10)
This map describes the number of animal and plant species that are at risk in Alberta. "Species at risk" is a term used by the Committee on the Status of Endangered Wildlife in Canada (COSEWIC) that includes the following categories of plants and animals: * Extirpated species - no longer in the wild in Canada. * Endangered species - species facing imminent extirpation or extinction. * Threatened species - likely to become an endangered species if nothing is done to reverse factors leading to its extirpation or extinction. * Species of special concern - species that may become threatened or endangered due to biological characteristics or identified threats.
Manure Production Index 2001 (11)
This map describes the relative amount of manure production in the agricultural area of Alberta. It is an estimate of the degree to which livestock production may contribute to nutrient loading, pathogens and odour. The classes shown on the map are ranked between 0 (lowest) and 1 (highest).
Ground Water Quality Risk (12)
This map displays an assessment of groundwater quality risk for the agricultural area of Alberta. Agricultural activities that may have an impact on groundwater quality include livestock, crop production and agrochemical use. These activities along with the physical characteristics represented by aquifer vulnerability and available moisture were combined to produce this map. The classes shown on the map were ranked from 0 (lowest risk) to 1 (highest risk).
Frost Free Period 1971-2000 (13)
Fertilizer Expense Index 2001 (14)
This map shows the relative expense of fertilizer and lime in the agricultural area of Alberta. It is an estimate of the degree to which agriculture may affect nutrient levels in surface and groundwater. The classes shown on the map are ranked between 0 (lowest) and 1 (highest).
Cultivation Intensity Index 2001 (15)
This map presents the relative cultivation intensity in the agricultural area of Alberta. Cultivation intensity refers to the frequency of cultivation associated with the following management systems: no till, conservation tillage, conventional tillage and summerfallow. It is an estimate of the degree to which cultivation contributes to wind and water erosion. The classes shown on the map are ranked between 0 (lowest) and 1 (highest).
Chemical Expense Index 2001 (16)
This map describes the relative expense of farm chemicals (herbicides, insecticides and fungicides) in the agricultural area of Alberta. It is an estimate of the degree to which crop production agriculture may contribute to surface or groundwater contamination. The classes shown on the map are ranked between 0 (lowest) and 1 (highest).
Biodiversity Risk (17)
This map displays an assessment of biodiversity risk for the agricultural area of Alberta. Biodiversity risk refers to the loss of biological diversity, or the variety of plant and animal life in agricultural landscapes. This decrease in biodiversity is believed to affect the overall health of the environment. A diverse ecosystem is better able to respond to environmental changes or stresses, such as floods, drought, pests and disease. The goal of maintaining biodiversity in agricultural landscapes may be more readily attained through prevention of further losses in areas less impacted by agriculture rather than through efforts to restore biodiversity in more heavily impacted areas. Information about physical features that affect biodiversity was combined with economic information on agricultural activities that show how human activity affects biodiversity. The classes formed as shown on the map were ranked from 0 (lowest risk) to 1 (highest risk).
Areal Extent of Wetlands (18)
This map displays the density of wetland habitat in the agricultural region of Alberta. Wetlands are depressional areas that are wet for a long enough period that the plants and animals living in them are adapted to, and often dependent on, living in wet conditions for at least part of their life cycle. In drier areas of the province, wetlands tend to be more intermittent, while in wetter areas, wetlands tend to be more persistent. Topography also affects the occurrence of wetlands. Hummocky landscapes allow for pooling of water in depressions, while landscapes with longer slopes (e.g. the foothills) generally have better defined surface drainage patterns. A wetland is influenced by the interaction between the wet area, the wetland margin and upland area.
Aquifer Vulnerability Index (19)
The Aquifer Vulnerability Index (AVI) is a method for assessing the vulnerability of aquifers to surface contaminants. An aquifer is a geologic formation that is permeable enough to transmit sufficient quantities of water to possibly support the development of water wells. In the assessment of aquifer vulnerability to potential contamination, the depth to the aquifer and the types of geological materials above them are considered. For example, aquifers closer to the surface overlain with pervious surface materials are more vulnerable to contaminants, as compared to aquifers found deeper and covered with thick layers of impervious materials. The AVI ratings indicate the potential of surficial materials to transmit water with contaminants to the aquifer over a period of time. The AVI ratings are displayed on the map in classes ranging from low to high. An area with a low class rating implies that water percolating through the surficial materials in this area takes a long time (in the range of thousands of years) to reach the aquifer. On the other hand, in an area with a high rating, contaminated water is predicted to reach the aquifer within "tens" of years.
Annual Total Precipitation 1971-2000 (20)
Annual Solar Radiation 1971-2000 (21)
Air Quality Risk (22)
This map displays an assessment of air quality risk for the agricultural area of Alberta. Agricultural activities that may have some influence on air quality include manure production (odour) and cultivation intensity (particulate matter). The airsheds of the agricultural region of Alberta are considered to be uniform in their physical susceptibility to risk from agricultural activities. The classes shown on the map were ranked from 0 (lowest risk) to 1 (highest risk).
There are currently no notifications for the service, click the feed icon to subscribe.