Agriculture and Agri-Food Canada |
|
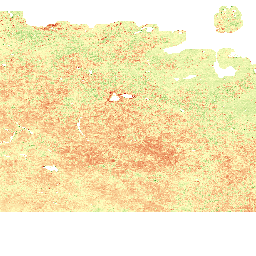
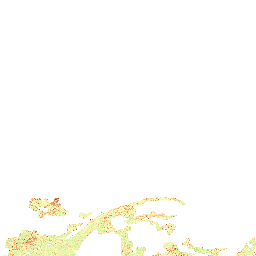
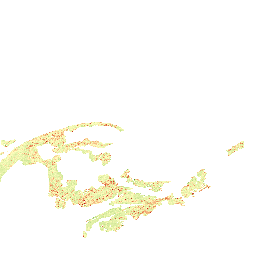
Weekly Best-Quality Maximum - NDVI Anomalies
| Service health Now: |
|---|
- Interface
- Web Service, OGC Web Map Service 1.3.0
- Keywords
- Remote sensing
- Fees
- unknown
- Access constraints
- © Government of Canada (2018). Data are subject to the Government of Canada Open Data Licence Agreement: http://open.canada.ca/en/open-government-licence-canada. The terms of this Agreement govern your use and reproduction of the data instead of the copyright reproduction statements found in Important Notices on the Agriculture and Agri-Food Canada website.
- Supported languages
- No INSPIRE Extended Capabilities (including service language support) given. See INSPIRE Technical Guidance - View Services for more information.
- Data provider
-
Agriculture and Agri-Food Canada (unverified)
Contact information:
Agri-Geomatics
Agriculture and Agri-Food Canada
Canada
Email:
- Service metadata
- No INSPIRE Extended Capabilities (including service metadata) given. See INSPIRE Technical Guidance - View Services for more information.
Ads by Google
In the "Weekly Best-Quality Maximum-NDVI anomalies" dataset series, each pixel value corresponds to the difference (anomaly) between the mean n-year "Best-Quality" Max-NDVI of the week specified (e.g. Week 18, 2000-2014) and the "Best-Quality" Max-NDVI of the same week in a specific year (e.g. Week 18, 2014). Max-NDVI anomalies < 0 indicate where weekly Max-NDVI is lower than normal. Anomalies > 0 indicate where weekly Max-NDVI is higher than normal. Anomalies close to 0 indicate where weekly Max-NDVI is similar to normal. For more information, visit: http://open.canada.ca/data/en/dataset/ea6b4be2-9826-47f3-a387-33ddf02592f4
Available map layers (1)
weekly_maximum_ndvi_anomaly (0)
In the "Weekly Best-Quality Maximum-NDVI anomalies" dataset series, each pixel value corresponds to the difference (anomaly) between the mean n-year "Best-Quality" Max-NDVI of the week specified (e.g. Week 18, 2000-2014) and the "Best-Quality" Max-NDVI of the same week in a specific year (e.g. Week 18, 2014). Max-NDVI anomalies 0 indicate where weekly Max-NDVI is higher than normal. Anomalies close to 0 indicate where weekly Max-NDVI is similar to normal. For more information, visit: http://open.canada.ca/data/en/dataset/ea6b4be2-9826-47f3-a387-33ddf02592f4
There are currently no notifications for the service, click the feed icon to subscribe.